Sustainable Groundwater
Data
Basic hydrologic data collection, processing, analysis, dissemination, and archiving are major parts of the California Water Science Center program. Streamflow data, for example, are used for flood and water-supply forecasts, planning and design, river regulation, streamflow statistics, and research investigations. Much of the data are available on a near-real-time basis by satellite telemetry.
Groundwater Data
California Active Groundwater Level Network contains water levels and well information from more than 20,000 wells that have been measured by the USGS or USGS cooperators at least once within the past 13 months.
NWIS: Groundwater Data for California
The Groundwater database consists of records of wells, springs, test holes, tunnels,drains, and excavations. Available information includes groundwater level data, well depth, aquifer, and more.
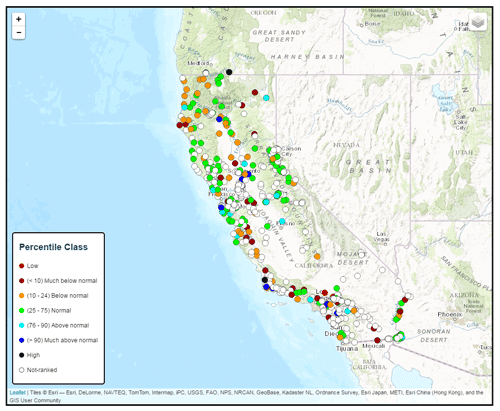
Groundwater Watch
Groundwater Watch groups related wells and data from active well networks reported in the USGS National Water Information System (NWIS), and provides basic statistics about the water-level data collected by USGS water science centers for Cooperative and Federal Programs, and from data supplied to us by our customers through cooperative agreements.
Surface Water Data
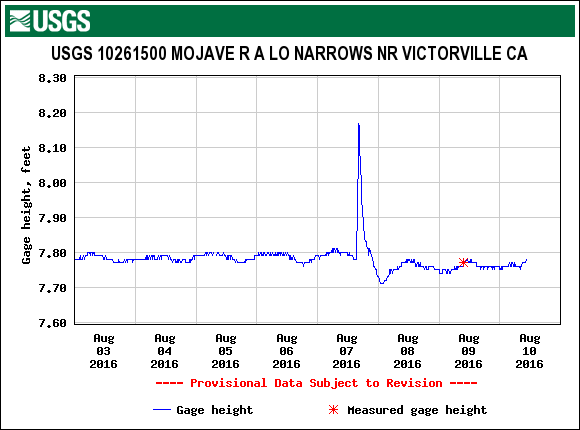
NWIS Surface-Water Data offers hydrographs, by site, for termperature, disharge, gage height, and specific conductance.
Current California Streamflow Conditions
Real-time streamflow data from automated equipment, representing the most current hydrologic conditions.
NWIS: Surface-Water Data for California
The Surface Water database consists of records of current streamflow conditions, historical observations, daily data, peak-flow data, and field measurements from streamgages across California.
Surface-Water Watch
Maps California streamgage sites and compares real-time streamflow to historical streamflow for the day of the year.
Water-Quality Data

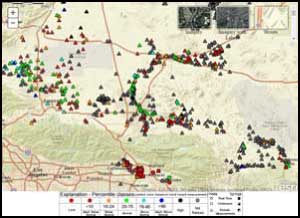
GAMA-Priority Basin Project Groundwater-Quality Results mapper displays water quality results for constituents of interest that have health- or non-health-based benchmarks, or are key tracers of groundwater age.
NWIS: Water-Quality Data for California
At selected surface-water and groundwater sites, the USGS maintains instruments that continuously record physical and chemical characteristics of the water including pH, specific conductance, temperature, dissolved oxygen, and percent dissolved-oxygen saturation. Supporting data such as air temperature and barometric pressure are also available at some sites.
Water-Quality Watch
Data from automated field equipment representing the most current hydrologic water quality conditions.
GAMA-Priority Basin Project Groundwater-Quality Results: Assessment and Trends
This interactive webmap plots water-quality data from domestic and public-supply wells sampled by the USGS for the California GAMA Priority Basin Project, and allows users to download datasets.
Land Subsidence Data
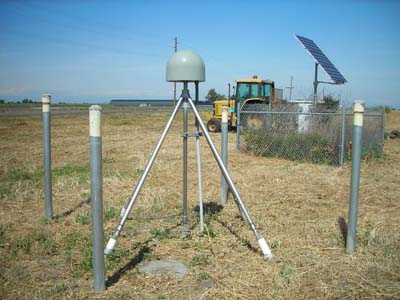
CGPS Station P303 in Los Banos, CA.
Interferometric Synthetic Aperture Radar (InSAR)
InSAR is a satellite-based remote sensing technique that can detect centimeter level land subsidence (and uplift) at high spatial detail. Synthetic Aperture Radar (SAR) imagery is produced by reflecting radar signals off a target area and measuring the two-way travel time back to the satellite. The InSAR technique uses two SAR scenes of the same area taken at different times which are then processed together to produce maps called interferograms that show relative land-surface-elevation change between the two SAR acquisition dates. This dataset is for the Central Valley. The Areas of Interest subset is where InSAR data has been interpreted to produce a time-history of subsidence.
Continuous GPS (CGPS)
The CGPS data can be obtained from the UNAVCO Plate Boundary Observatory (PBO) network of continuously operating GPS stations. The PBO is the geodetic component of UNAVCO, a consortium of research institutions whose focus is measuring vertical and horizontal plate boundary deformation across the North American and Pacific Plates in the western United States using high-precision measurement techniques.
Extensometers
Aquifer-system compaction has been monitored at selected locations for various periods with borehole extensometers by different agencies, including the USGS, DWR, SLDMWA, and CCID, and by Luhdorff and Scalmanini Consulting Engineers. A total of 35 extensometers have been monitored in the San Joaquin Valley, with most of the monitoring occurring in the 1950s and 1960s through the early 1980s. Four cable-type extensometers were refurbished: 12S/12E-16H2 (Oro Loma Deep, 305-m depth), 14S/13E-11D6 (Panoche, 414-m depth), 18S/16E-33A1 (DWR Yard, 314-m depth), and 20S/18E-6D1 (Rasta, 264-m depth). The refurbishment of the four selected extensometers was completed in early 2012. Since then, the sites have been maintained by USGS personnel who download the data, make manual dial-gauge and water-level measurements for quality control, and adjust equipment.
Benchmark Sites
Benchmarks (also called geodetic monuments or control points) generally consist of flat metal disks or other sturdy materials that are anchored in the ground or to a structure and can be surveyed for elevation repeatedly to calculate elevation change. Historical benchmark elevation data generally can be obtained by contacting the National Geodetic Survey. The Bureau of Reclamation has been surveying a network of over 70 benchmarks across the San Joaquin Valley in July and December of each year, beginning in 2011, to monitor ongoing subsidence. Reclamation's data is available online.
Have a SGMA science question or collaboration idea?
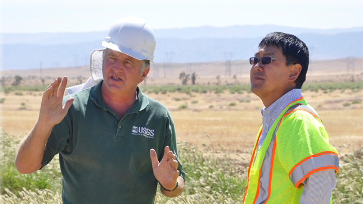
The USGS California Water Science Center works with Local, State and other Federal agencies to conduct studies that will help give water managers the knowledge they need to effectively allocate water resources under increasing demands.
USGS Data & Conditions
- Real-Time Data
- Streamflow
- WaterWatch
- USGS Data Mapper
- Groundwater
- Data | Watch | Regional
- Surface Water
- Data | Watch
- Water-Quality
- Data | Watch | Mapper
- USGS WaterNow
- Current-conditions for water data directly to your mobile phone or email.