Water-Level Studies in the Antelope Valley and Fremont Valley Groundwater Basins
Antelope Valley Water-Level Studies
Groundwater systems are dynamic and adjust continually to short-term and long-term changes in climate, ground-water withdrawal, and land use. Water-level measurements from observation wells are the principal source of information about the hydrologic stresses acting on aquifers and how these stresses affect groundwater recharge, storage, and discharge. Long-term, systematic measurements of water levels provide essential data needed to evaluate changes in the resource over time, to develop groundwater models and forecast trends, and to design, implement, and monitor the effectiveness of groundwater management and protection programs.
Regional water-table maps of the Antelope Valley groundwater basin have been published by the U.S. Geological Survey (USGS) since 1911 (Johnson, 1911; Bloyd, 1967; Blankenbaker, 1978; Londquist and others, 1993; Carlson and others, 1998; Dick and Teague, 2018).
Water-Level Mapping Methodology
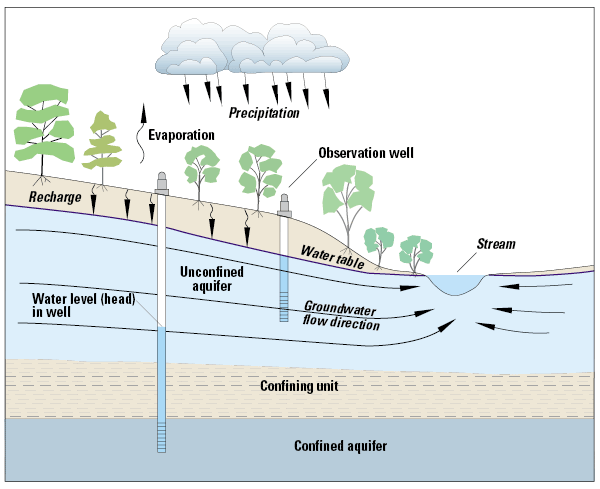
Cross-section sketch of a typical groundwater-flow system showing the relation between an unconfined and confined aquifer, a water table, and other hydrologic elements. Two general types of aquifers-unconfined and confined-are recognized. In unconfined aquifers, hydraulic heads fluctuate freely in response to changes in recharge and discharge. Water levels measured in wells completed in the upper part of an unconfined aquifer help define the elevation of the water table, which is the top of the saturated zone. In confined aquifers, sometimes known as "artesian" aquifers, water in the aquifer is "confined" under pressure by a geological body that is much less permeable than the aquifer itself. Water levels in tightly cased wells completed in confined aquifers often rise above the elevation of the top of the aquifer. These water levels define an imaginary surface, referred to as the potentiometric surface, which represents the potential height to which water will rise in wells completed in the confined aquifer. Many aquifers are intermediate between being completely unconfined or confined.
The water-level map in this report shows the altitude of the water table above a vertical datum for March 2014. The water-level measurements used for the water-level contour map are from wells of various depths. Although these wells may have different depths, the measured water levels reasonably represent the water-table altitude.
In areas where sufficient data exist, points of equal water-level altitude were connected by contour lines to show the general direction of groundwater flow. In areas where water-level data were unavailable, previously published data were used as a guide to draw contours. In some areas of the maps, water-level measurements were affected by recent pumping, or nearby wells that were pumping, which resulted in steep water-level gradients and water-level contours that bend abruptly around wells.
The water levels presented on the map were measured using a calibrated steel or electric tape. The water-level altitude was determined by subtracting the water-level measurement (depth to water, in feet below land surface) from the established land-surface referenced to the North American Vertical Datum of 1988 (NAVD 88).
Water-Level Changes
The difference in water-level altitudes calculated from water-level measurements for years 1996 and 2014 are displayed on a water-level change map. Additionally, historical water-level data (as early as 1917) were used in conjunction with data collected for each map to show long-term water-level changes in the Antelope Valley and Fremont Valley groundwater basins. Long-term water-level changes, shown by hydrographs, are depicted for 31 wells, or groups of wells. Some hydrographs combine data from more than one well to show water-level changes throughout a longer period of time for a particular area.
Stakeholders
Antelope Valley State Water Contractors Association (AVSWCA)
Contacts
Project Chief:
Meghan Dick
Hydrologist
USGS California Water Science Center
4165 Spruance Rd. Ste 200
San Diego, CA 92101
Office: 619-225-6154
Maps
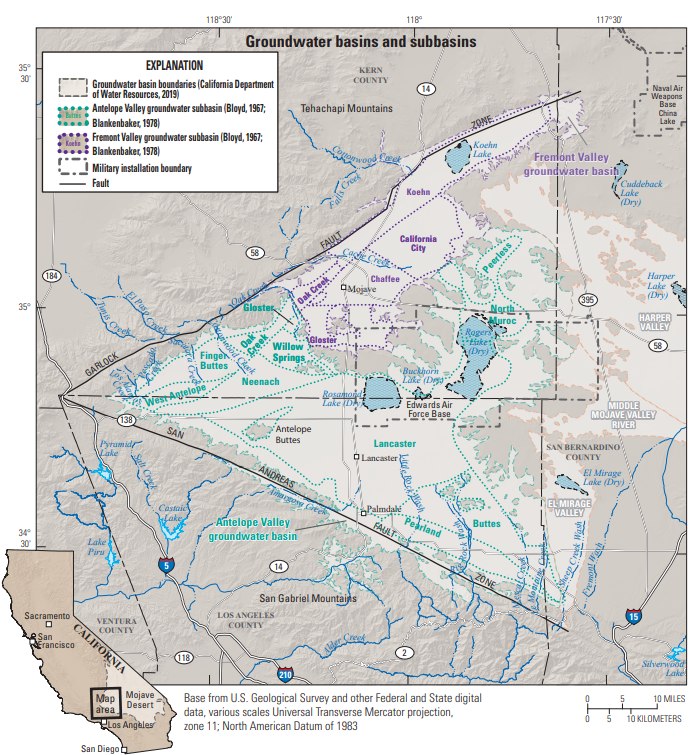
Antelope & Fremont Valleys: Detailed Basin Map
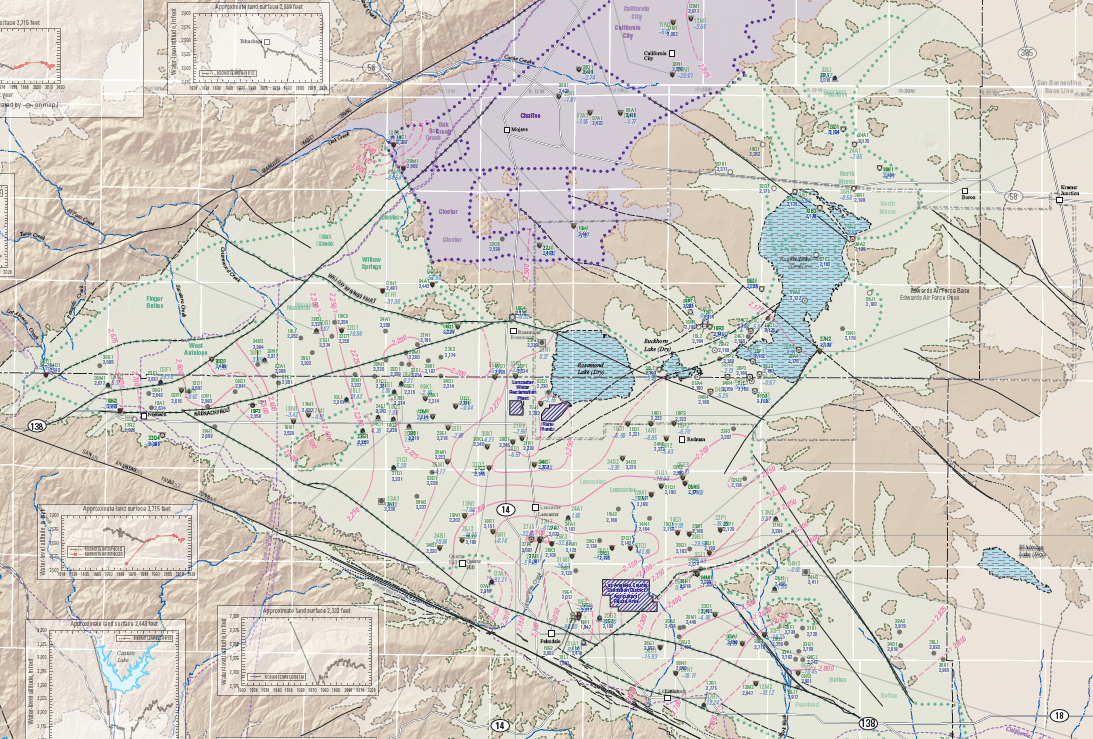
Antelope Valley Water-Level Contours
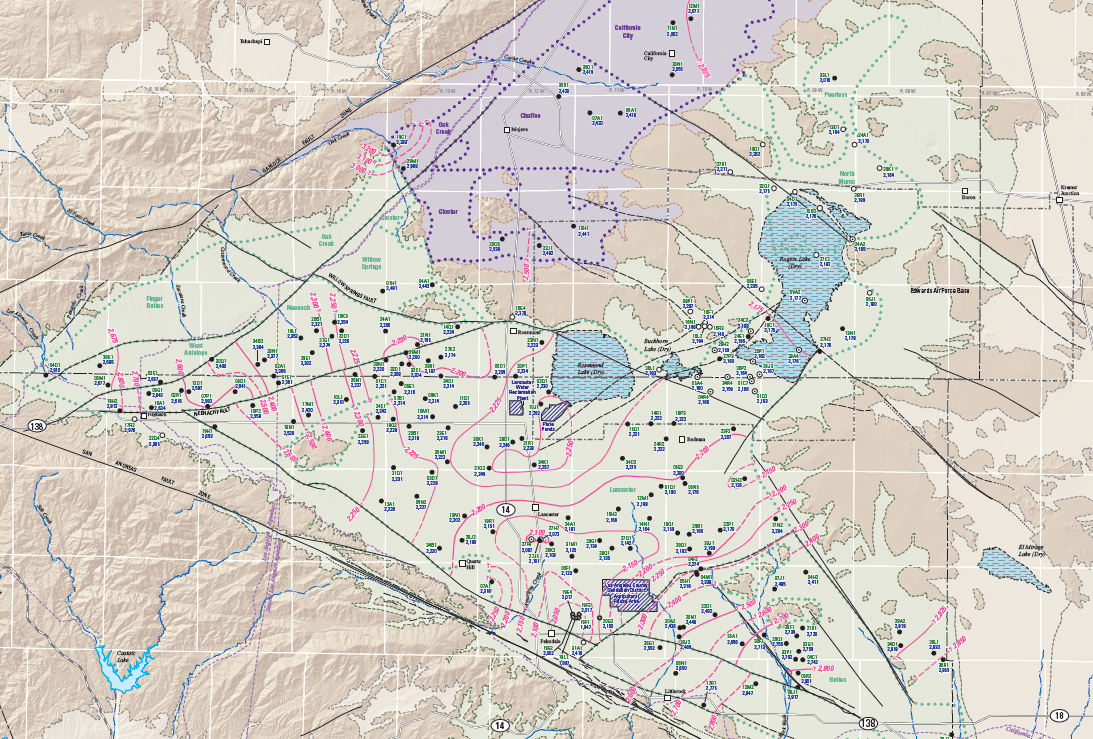
Antelope Valley Water-Level Changes