Mojave Groundwater Resources
Mojave Scientific Visualizations
Lifeblood of the Desert
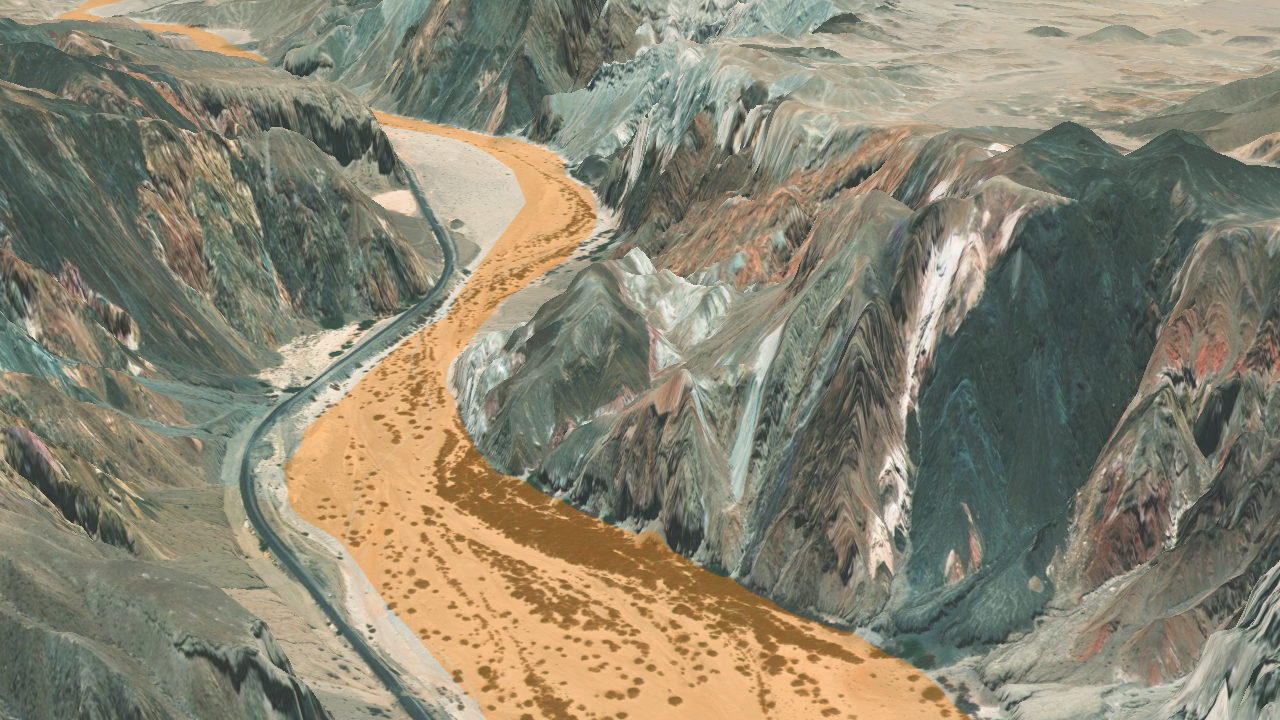
This geonarrative talks about the history of the Mojave River and importance and influence on water supply in the southwestern Mojave Desert. It features a 3D fly over tour of the river's length, as well as interactive geological cross sections.
Antelope Valley and El Mirage Valley Groundwater Basins Boundary Hydrogeologic Assessment
Excerpted from SIR 2017-5065
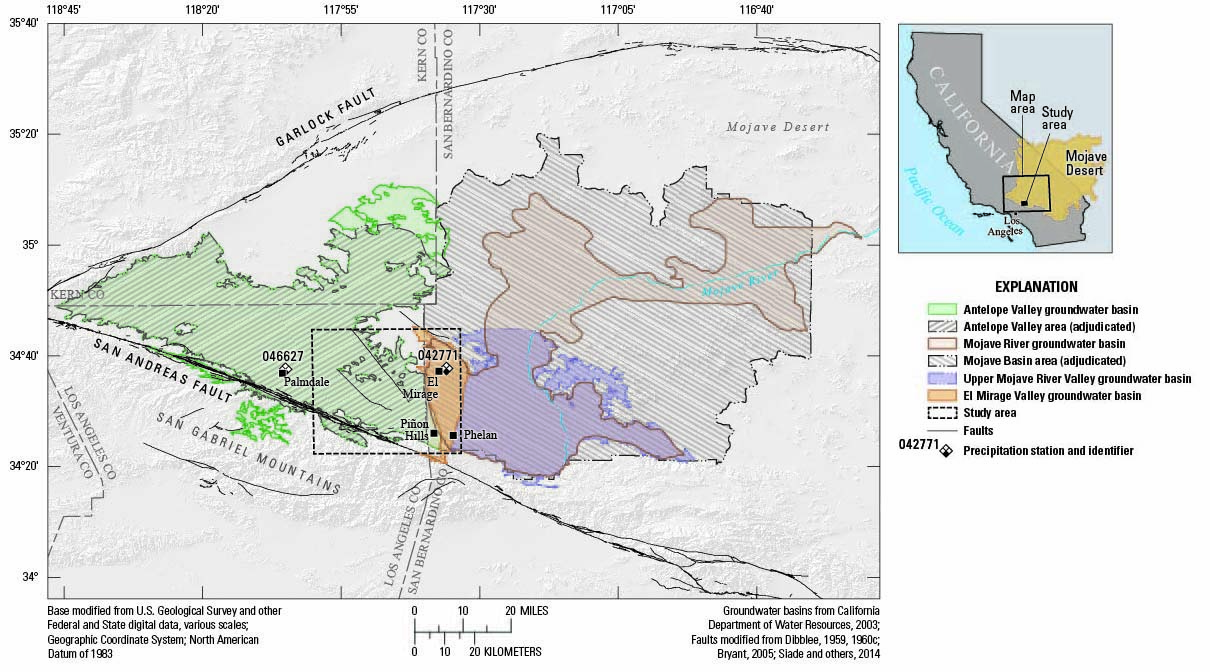
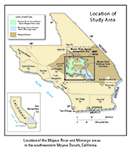
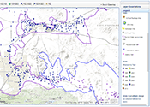
Location of study area and boundaries of the groundwater basins near Piñon Hills, California.
The Antelope Valley and El Mirage Valley basins have been adjudicated to ensure that groundwater rights are allocated according to legal judgments. In an effort to assess if the boundary between the Antelope Valley and El Mirage Valley groundwater basins could be better defined, the U.S. Geological Survey began a cooperative study in 2014 with the Mojave Water Agency to better understand the hydrogeology in the area and investigate potential controls on groundwater flow and availability, including basement topography.
Animation showing the altitude of the top of the basement rocks based on the gravity data and altitude of the water table in 2014–15, near Piñon Hills, California.
Animation showing the potential dewatering of the saturated alluvium starting with the 2014–15 water-table altitude and assuming an incremental 16.4 feet (5 meter) drop per frame of the water table, near Piñon Hills, California.
Groundwater Flow Simulation
To better understand the relation between the aquifer systems and the Mojave River and to develop a management tool that could be used to estimate the effects that future stresses may have on the groundwater system, a numerical groundwater flow model of the Mojave River groundwater basin was developed (Stamos and others, 2001), in part, on the basis of a previously developed analog model (Hardt, 1971). To visualize the magnitude, spatial distribution, and timing of water-level changes in the basin through time, simulated hydraulic heads for 1931-99 were compared with simulated hydraulic heads for 1931 on an annual basis (Stamos and others, 2002).
The calibrated flow model (Stamos and others, 2001) also was used to evaluate six proposed water-management alternatives using water from the California State Water Project (SWP) during the 20-year simulation period of 2000-2019 (Stamos and others, 2002).
Alternative 1
The simulated hydraulic-head change resulting from water-management alternative 1 was compared to 1999 initial conditions. Water-management alternative 1 assumed that no SWP water was available.
Alternative 2
Water-management alternative 2 assumed that 30,000 acre-ft/yr of SWP was recharged to the Mojave River in the upper part of the Alto subarea.
Alternative 3
Water-management alternative 3 assumed that 4,000 acre-ft/yr of SWP water was recharged to the upper part of the Alto subarea, away from the Mojave River.
Alternative 4
Water-management alternative 4 assumed that 10,000 acre-ft/yr of SWP water was recharged in the Baja subarea.
Alternative 5
Water-management alternative 5 assumed that 23,800 acre-ft/yr of SWP water was delivered directly to municipal water districts in lieu of pumpage in the Alto subarea.
Alternative 6
Water-management alternative 6 assumed that 3,800 acre-ft/yr of SWP water was delivered directly to municipal water districts in lieu of pumpage in the Transition zone subarea.
Mojave Region Maps
General Location
Detailed Location Map
Interactive Data Map
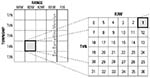
Well-Numbering System

To view PDF documents, you must have Adobe Reader installed on your computer.