Mojave Groundwater Resources
Interferometric Synthetic Aperture Radar (InSAR)
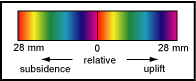
On the phase images, an area of coherent displacements, for example an area of subsidence, is shown by color fringes that define a shape; more color fringes indicate more change. For the interferograms in this report, one color cycle, for example blue to blue, indicates 28 mm (0.09 ft) of range displacement or change. The direction of change—subsidence or uplift—is indicated by the color progression of the fringes toward the center of the shape. The color-fringe progression of red-orange-yellow-green-blue-purple indicates subsidence; the opposite progression indicates uplift.
InSAR is an effective way to measure land-surface deformation over large areas. InSAR is a satellite-based remote sensing technique that can detect ground-surface displacement on the order of about one-half of an inch over thousands of square miles with spatial resolution on the order of about 300 feet or less (Bawden and others, 2003). This technique has been used to investigate deformation resulting from earthquakes (Massonnet and others, 1993), volcanoes (Massonnet and others, 1995), groundwater and oil-extraction related land subsidence (Massonnet and others, 1997; Fielding and others, 1998; Galloway and others, 1999; Amelung and others, 1999; Hoffmann and others, 2001; Sneed and others, 2003; Sneed and others, 2014, Sneed and Brandt, 2020), glacial movement (Kaab, 2005), and landslides (Bayer, 2017).
Synthetic Aperture Radar (SAR) imagery is produced by reflecting radar signals off a target area and measuring the two-way travel time back to the satellite. The SAR interferometry technique uses two SAR images of the same area acquired at different times and "interferes" them (to measure differences), resulting in maps called interferograms that show line-of-sight ground-surface displacement (range change) between the two time periods. The generation of an interferogram produces two components; amplitude and phase. Amplitude is the measure of the radar signal intensity returned to the satellite and depends on the variable reflective properties of the landscape and shows features such as buildings, roads, mountains, and other reflective features. The phase component is proportional to line-of-sight distance from the ground to the satellite (range) and is the component used to measure land-surface deformation (uplift or subsidence). If the ground has moved away from the satellite (subsidence), or towards the satellite (uplift) between the times of the two SAR acquisitions, a slightly different portion of the wavelength is reflected back to the satellite, resulting in a measurable phase shift that is proportional to displacement. The phase difference is calculated for each pixel within the image extent. The indicated line-of-sight displacement can then be converted to vertical displacement using the radar look-angle properties of the satellite. The map of phase shifts, or interferogram, can be depicted with a color scale that shows relative displacement between the first and the second SAR acquisitions relative to a reference pixel.
Interferogram quality is partly dependent on satellite position, atmospheric effects, ground cover, land use practices, and time span of the interferogram. Strict orbital control is required to precisely control the look angle and position of the satellite. Successful application of the InSAR technique is contingent on looking at the same point on the ground from the same position in space, such that the horizontal distance between each satellite pass, or perpendicular baseline, is minimized. Excessive perpendicular baselines can cause topographic effects (parallax ) that can mask real signal, and these errors become more pronounced in areas with high topographic relief. The error attributed to topographic effects is calculated using a digital elevation model (DEM) and satellite orbit information and is removed during the interferogram generation process. The DEM is also used to georeference the image.
Phase shifts also can be caused by atmospheric moisture associated with either variable land-surface elevation (higher elevations have less atmosphere) or clouds and fog. Atmospheric moisture slows the radar signal which causes a phase shift that can lead to erroneous deformation interpretations (Zebker and others, 1997). When apparent ground motion is detected only in one interferogram, or a set of interferograms sharing a common SAR image, then the apparent motion likely is because of atmospheric phase delay and can be discounted or corrected by generating a composite interferogram from the individual interferograms. For example, two interferograms are generated from a set of three SAR images taken at three different times. If a cloud is suspected in the middle of those three acquisitions, the apparent deformation measured using the early and middle SAR acquisitions will appear as subsidence (increased phase), and the apparent deformation measured using the middle and late SAR acquisitions will appear as uplift (decreased phase). When these two interferograms are added (stacked) together, the equal and opposite phase change will be cancelled out in the composite interferogram, effectively removing the portion of phase change caused by the cloud.
The type and density of ground cover (vegetation, standing water, or certain land use practices) also can significantly affect interferogram quality. Densely forested areas are prone to poor signal quality because the C-band wavelength (about 2.2 inches) cannot effectively penetrate thick vegetation and is either absorbed or reflected back to the satellite from varying depths within the canopy, resulting in decorrelated signal (shown as randomized colors on an interferogram). Standing water (from a flooded lakebed, for example) also results in decorrelated signal because the radar signal reflects off the moving water-surface. Certain land use practices, such as farming, also cause decorrelated signal return. The tilling of farm fields causes large and non-uniform ground-surface change that cannot be resolved with InSAR. Signal quality also is adversely affected by large temporal separations, as there is more opportunity for non-uniform change to occur in both urban and non-urban areas. Stacking two or more interferograms that span shorter periods can correct for atmospheric delays (described earlier and result in more spatially correlated longer-term interferograms. However, sparsely vegetated areas and urban centers generally have high signal quality because bare ground, roads, and buildings are relatively uniform during at least some range of InSAR timescales. The Mojave Desert is generally suitable for InSAR analyses because it is sparsely vegetated, arid, and the areas near the lakebeds where subsidence was measured are fairly flat.
Post-processing techniques, including image smoothing and unwrapping, were used to maximize data quality and interpretability of the interferograms. Image smoothing was used in cases where interferograms containing spatially decorrelated areas (shown as randomly colored pixels on an interferogram) prevented reliable interpretation at these locations. Computer algorithms were used to adjust the image based on the average phase value of surrounding pixels, thereby reducing noise and increasing spatial correlation (Goldstein and Werner, 1998). However, over-smoothing an interferogram can remove small scale deformation features or local maxima/minima. Over-smoothing can also create false signal in areas of very low spatial correlation because successively averaging a set of random pixels (for example, from agricultural land use practices or flooded lake beds) will inevitably lead to a well correlated set of pixel values that likely are not reliable data points. Therefore, adjustments used to smooth images must be made carefully.
After smoothing, images must be “unwrapped” in order to successfully extract range (and ultimately, elevation) change information from InSAR data. Interferograms contain data values that repeat from 0 to 2 pi (a sine wave) and are termed “wrapped” interferograms. When a series of pixels indicates an increasing phase change, the value “wraps” from 2 pi back to zero, and each time the phase value “wraps,” one-half the satellite’s wavelength of range change has been measured. Phase unwrapping was performed using a minimum cost flow algorithm (Werner and others, 2002). Every pixel used for unwrapping must be fairly well correlated with an adjacent pixel in order to successfully unwrap the entire image. If a set of well correlated pixels are surrounded by poorly correlated pixels, the amount of range change across that poorly correlated area cannot be reliably determined.
Mojave Region Maps
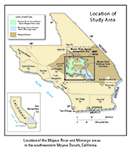
General Location
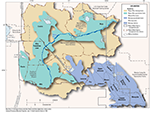
Detailed Location Map
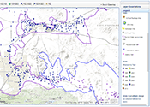
Interactive Data Map
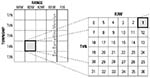
Well-Numbering System

To view PDF documents, you must have Adobe Reader installed on your computer.