San Antonio Creek Water Availability
Surface-Water Monitoring
The San Antonio Creek surface-water drainage basin encompasses over 150 square miles with the main drainage, San Antonio Creek, generally flowing from east to west to the Pacific Ocean. Streamflow is primarily ephemeral; measurable flow in is usually in response to storms or surface runoff from nearby agriculture. About 5 miles east of the Pacific Ocean, consolidated marine deposits form a barrier to groundwater flow and the upwelling of groundwater has created a 660-acre marshland known as Barka Slough. Discharge of groundwater to land surface in the vicinity of Barka Slough results in perennial flow in the Creek downstream of the Slough. This slough, one of the few pristine marshlands in southern California, is known or believed to be inhabited by at least nine threatened or endangered species of wildlife, including California red-legged frog, southwestern pond turtle, endangered tidewater goby, three-spine stickleback, and California tiger salamander (Descheneaux, 19751).
Historical water budgets for the San Antonio Creek Valley have indicated that infiltration of ephemeral streamflow from winter storm runoff is a major source of recharge to the groundwater system (Martin, 1984). Similarly, groundwater discharge to Barka Slough is the major natural discharge from the basin and is critical for maintaining riparian wetland habitat supporting endangered species. For these reasons, as part of a comprehensive hydrologic investigation, it is important to make field measurements that can be used to determine independent estimates of surface water movement throughout the basin and estimates of groundwater/surface water interactions.
Measuring Surface Water
Streamflow Gaging
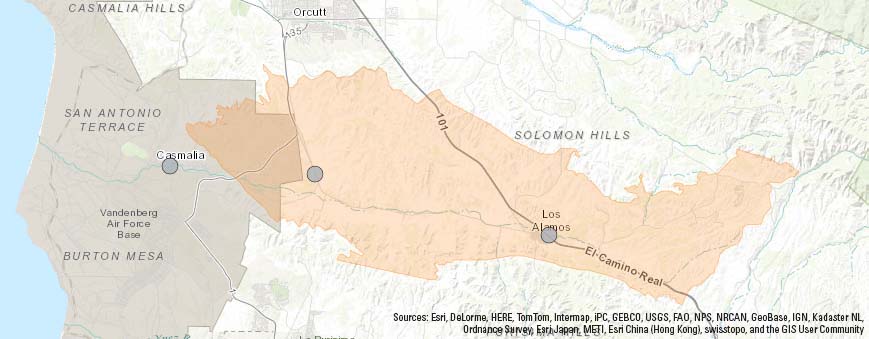
Streamgage sites in the San Antonio Creek Valley. Map image is the intellectual property of Esri and is used herein under license.
Monitoring streamflow at long-term stream gages enables understanding of the surface expression of the hydrology. Streams can either lose water to the groundwater system by infiltration along the stream channel, or gain water from the groundwater system when the water table intersects the stream channel. Monitoring the flow at various points helps determine where and when different conditions occur.
TThe USGS currently measures streamflow at 3 locations along San Antonio Creek: one upstream of the town of Los Alamos (Los Alamos gage), one where San Antonio Creek leaves the basin (Casmalia gage), and one on a tributary to San Antonio Creek (Harris Canyon Creek gage). The Los Alamos gage has been in operation since 1970; the Casmalia gage was re-activated with funding from this study; the Harris Canyon Creek gage was installed in December 2016.
- San Antonio Creek at Los Alamos (USGS 11135800 SAN ANTONIO C A LOS ALAMOS CA)
- San Antonio Creek near Casmalia (USGS 11136100 SAN ANTONIO C NR CASMALIA CA)
- Harris Canyon Creek near Orcutt (USGS 11136040 HARRIS CANYON C NR ORCUTT CA)
Related Streamgage Publications
U.S. Geological Survey Streamgaging (Olson and Norris, 2007)
From the River to You: USGS Real-Time Streamflow Information (Nielsen and Norris, 2007)
Streambed Electrical Resistance Sensors (SERS)
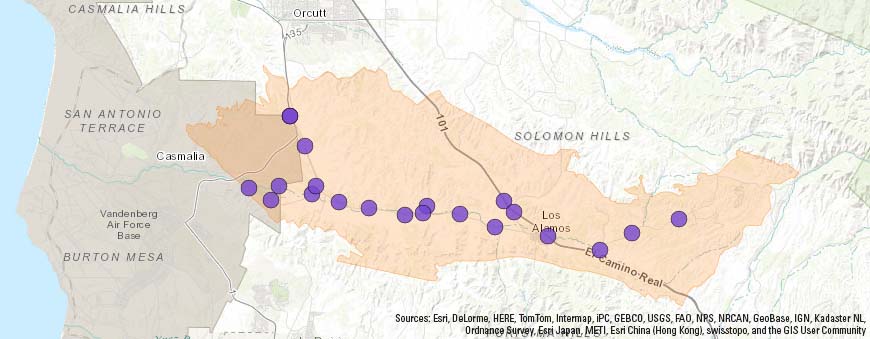
Twenty-one Streambed Electrical Resistance Sensor (SERS) sites have been temporarily installed in along drainages throughout the San Antonio Creek Valley. Map image is the intellectual property of Esri and is used herein under license.
Streambed Electrical Resistance Sensors (SERS) record when water is present or absent in a stream channel and provide a means of remotely monitoring streamflow duration. The SERS are deployed inside a metal box, 4 inches wide (square) by 10 inches long. The bottom of the box is at streambed level. The metal box is attached to a metal T-post pounded into the streambed. Over twenty SERS have been temporarily installed in creeks and tributaries throughout the Valley.
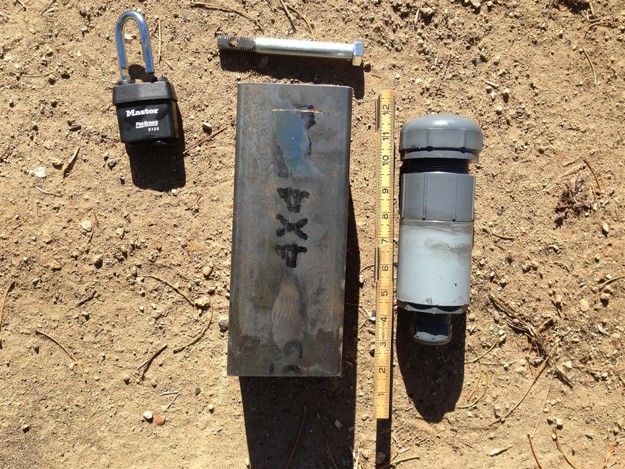
Component parts of a streambed electrical resistance sensor (SERS) including (from left to right) lock, metal box, and datalogger/sensor.
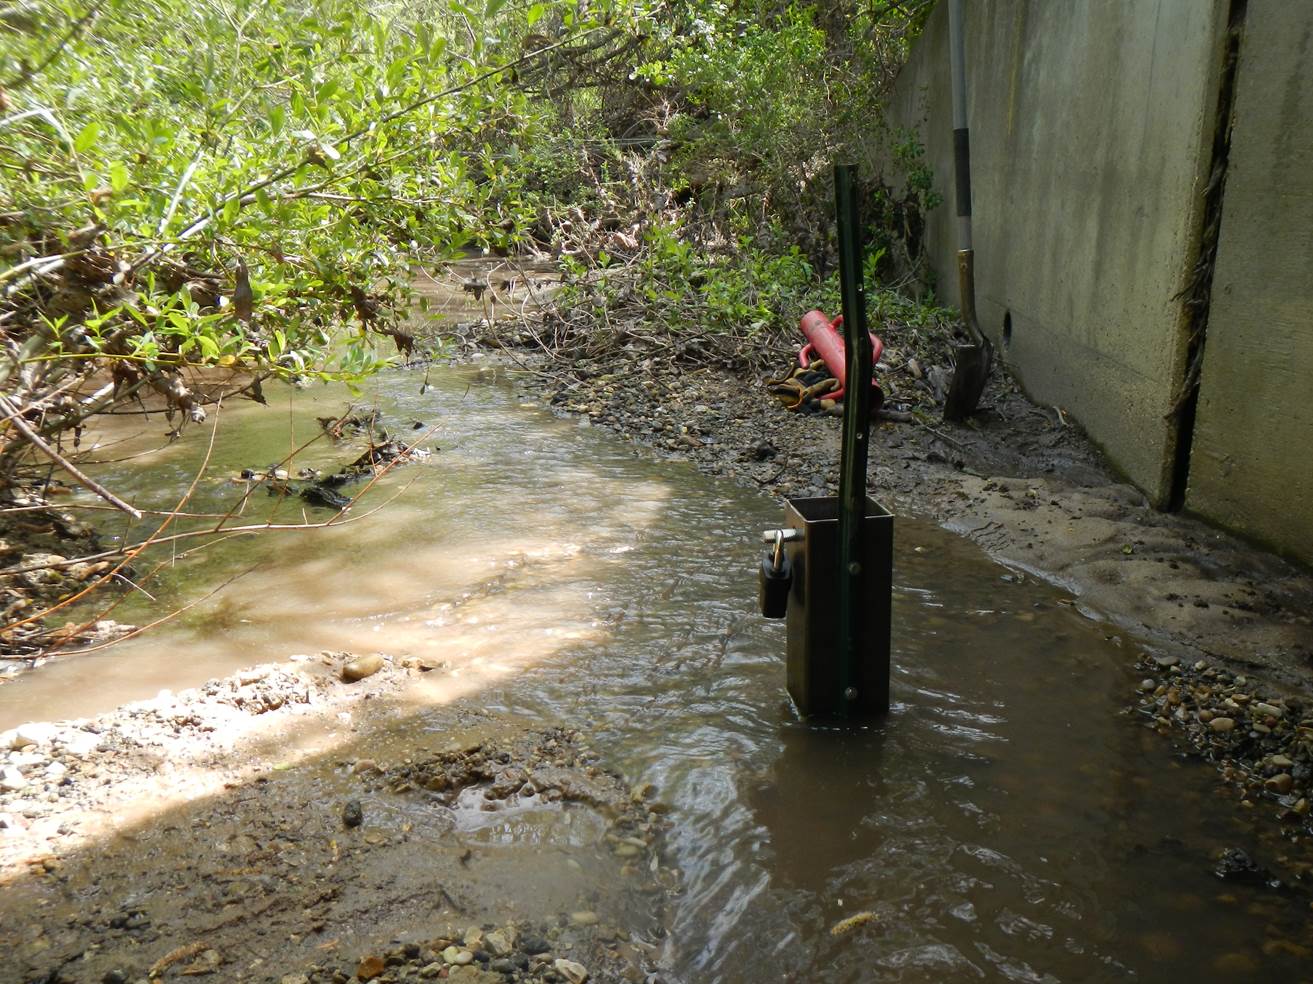
Streambed electrical resistance sensor (SERS) deployed in a streambed with flowing water. The presence of water is recorded as a low resistance (high conductivity) signal from the sensor.
Related Streambed Electrical Resistance Sensor Publications
Robust, low-cost data loggers for stream temperature, flow intermittency, and relative conductivity monitoring (Chapin et al., 2014)
Infiltrometers
Infiltrometers were used to measure the infiltration rate of shallow material in the stream channels and surficial deposits at selected locations in the study area. Infiltrometer data were collected in August/September of 2017.
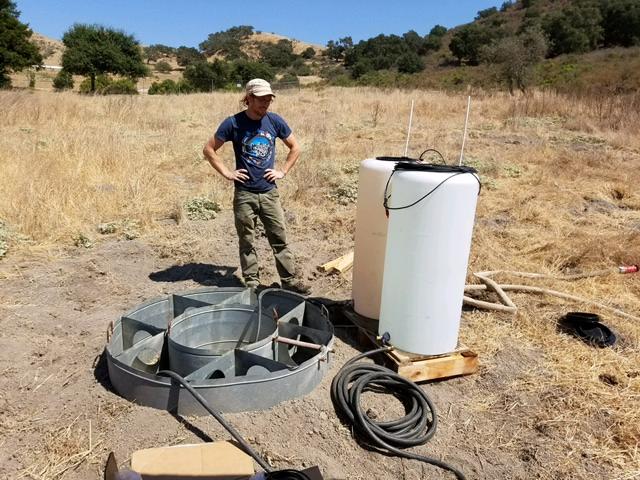
USGS personnel setting up infiltrometer in preparation for data collection.
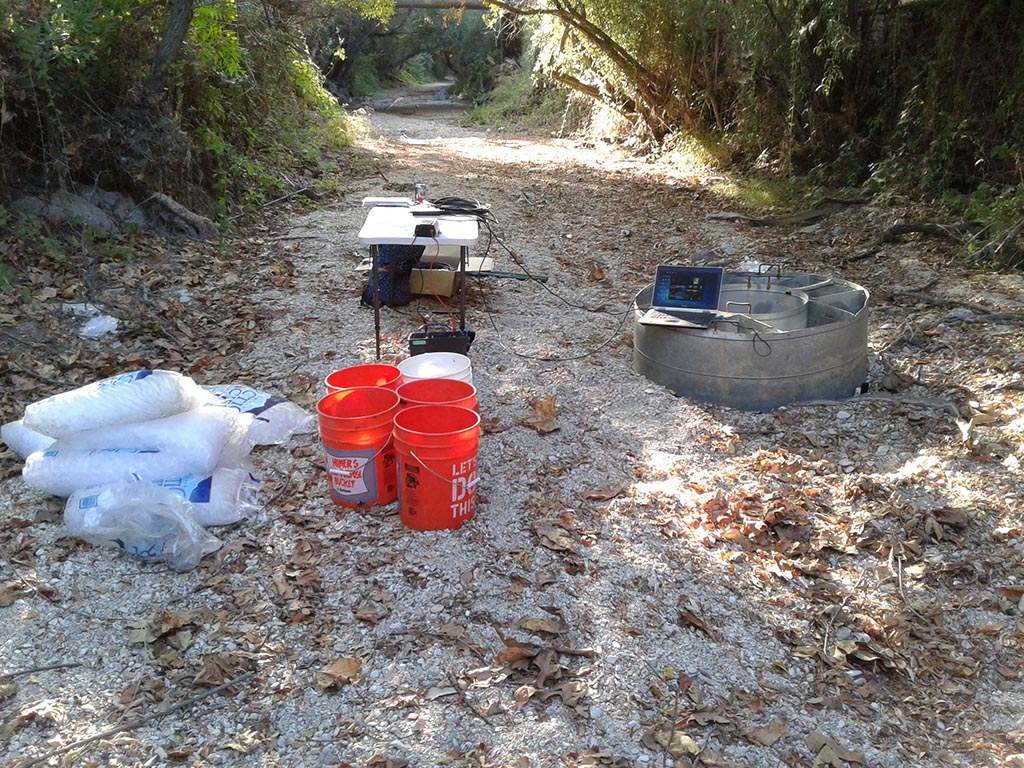
Infiltrometer testing in ephemeral streambed.
Temperature Rods (TROD)

Vertically nested temperature sensors installed inside a temperature rod (TROD) have been installed at three locations along San Antonio Creek. Map image is the intellectual property of Esri and is used herein under license.
Vertically nested temperature sensors have been installed at three locations along San Antonio Creek. Each rod was deployed to a total depth of about 3.3 feet in the primary drainage channel to measure temperature changes in the subsurface. These temperature changes will be used to evaluate vertical infiltration rates in the surrounding streambed. Streambed temperature can be used to derive time-series infiltration rates related to dynamic streamflow conditions, such as those that are present in ephemeral streams.
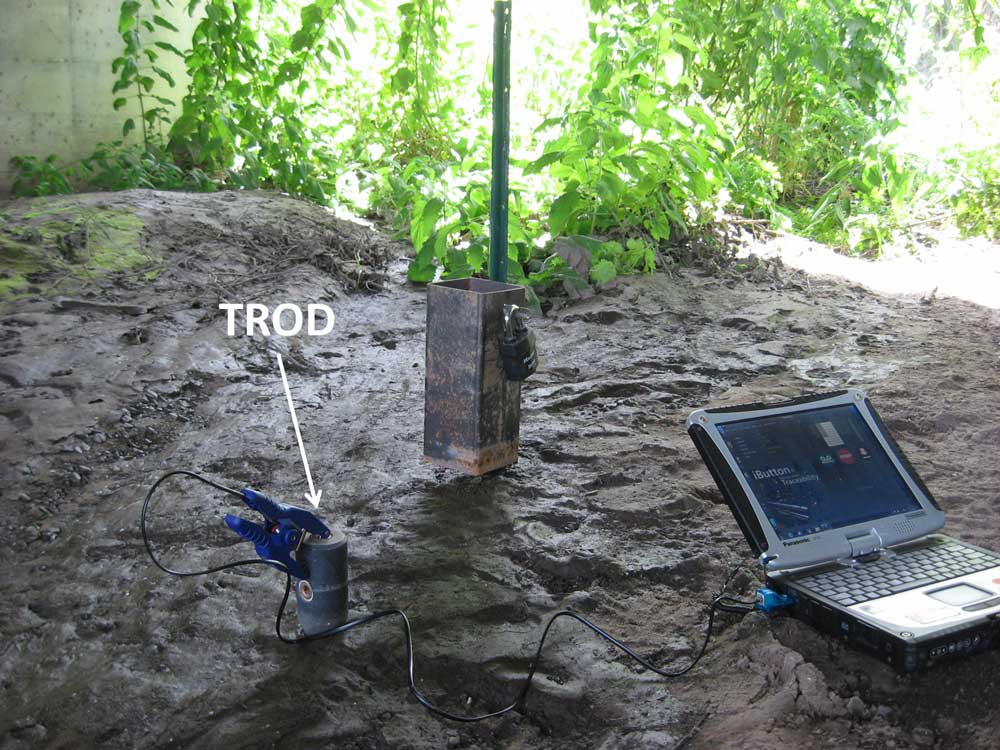
Temperature rod (TROD) installed adjacent to a streambed electrical resistance sensor (SERS). TROD data are downloaded using a laptop and communication cable.
Related Temperature Rod Publications
A new temperature profiling probe for investigating groundwater-surface water interaction (Naranjo and Turcotte, 2015)
1 Descheneaux, R.V., 1975, New water wells in San Antonio watershed: Vandenberg Air Force Base Environmental Impact Report, 4392d Civil Engineering Squadron, U.S. Air Force,, 19 p.
Cooperating Agencies

Santa Barbara County Water Agency
![]()
Related USGS Publications
Appraisal of Ground-Water Resources in the San Antonio Creek Valley
Geology and Ground Water of San Antonio Creek Valley, Santa Barbara County, California
Groundwater Quality in the South Coast Range Coastal Groundwater Basins, California
Other Related Publications
San Antonio Creek Coordinated Resource Management Plan
Ground Water Quality and Hydrology Data, San Antonio Creek Basin
Potential Effects of Increased Ground-Water Pumpage on Barka Slough, San Antonio Creek Valley