San Antonio Creek Water Availability
Groundwater Monitoring
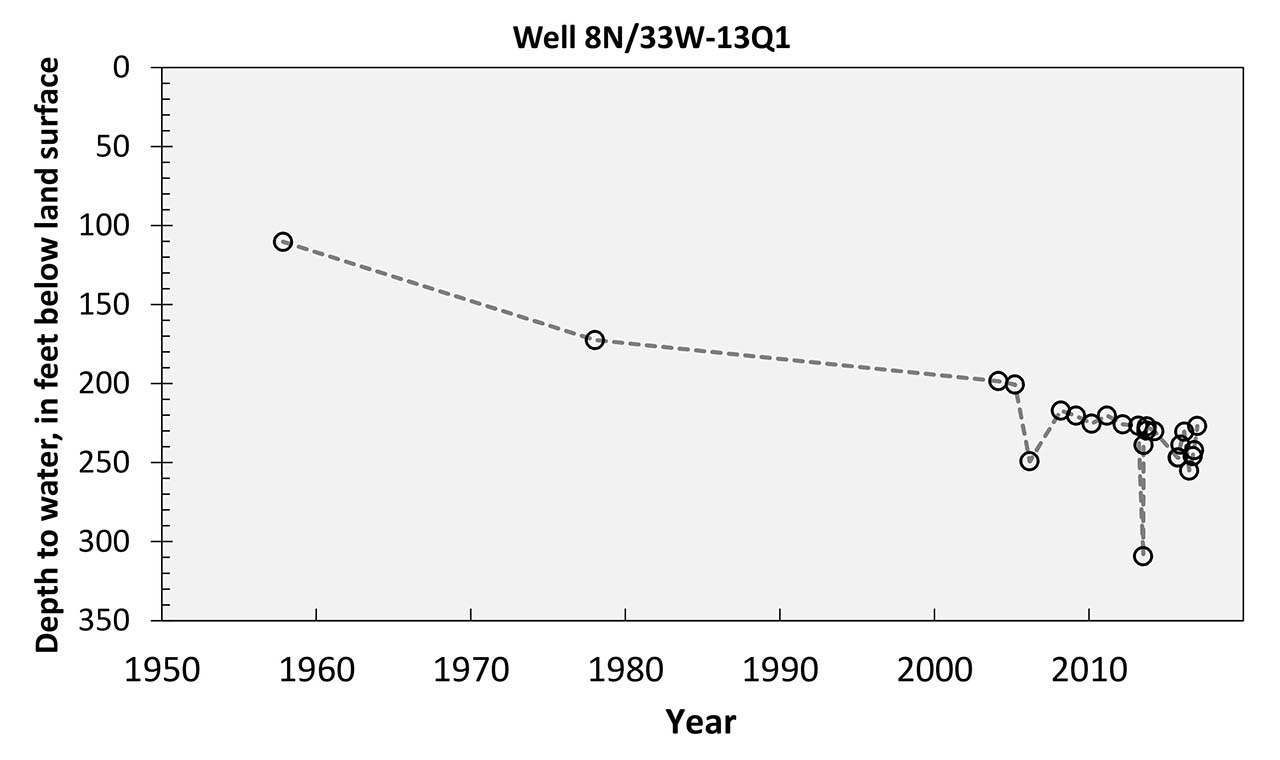
Measured depth to water in well 008N033W13Q001S (8N/33W-13Q1).
Groundwater is the main source of water in the San Antonio Creek Valley. Demand for groundwater in the predominantly rural valley has increased significantly because of the establishment of extensive irrigated agriculture on formerly non-irrigated land. Groundwater withdrawals have resulted in measured water-level declines ranging from 35 to more than 100 feet since the 1950s. Many stakeholders are concerned that continued water-declines correspond to negative implications for groundwater sustainability. To plan for future use, it will be important to evaluate the quantity and quality of the groundwater in the valley and establish tools to allow stakeholders to make informed management decisions.
The USGS currently measures water levels quarterly in more than 30 wells within or immediately adjacent to the San Antonio Creek groundwater basin. During this study, the number of wells measured quarterly will be increased, and new monitoring wells will be installed and added to the network. Selected wells will be instrumented with pressure transducers to record hourly water levels.
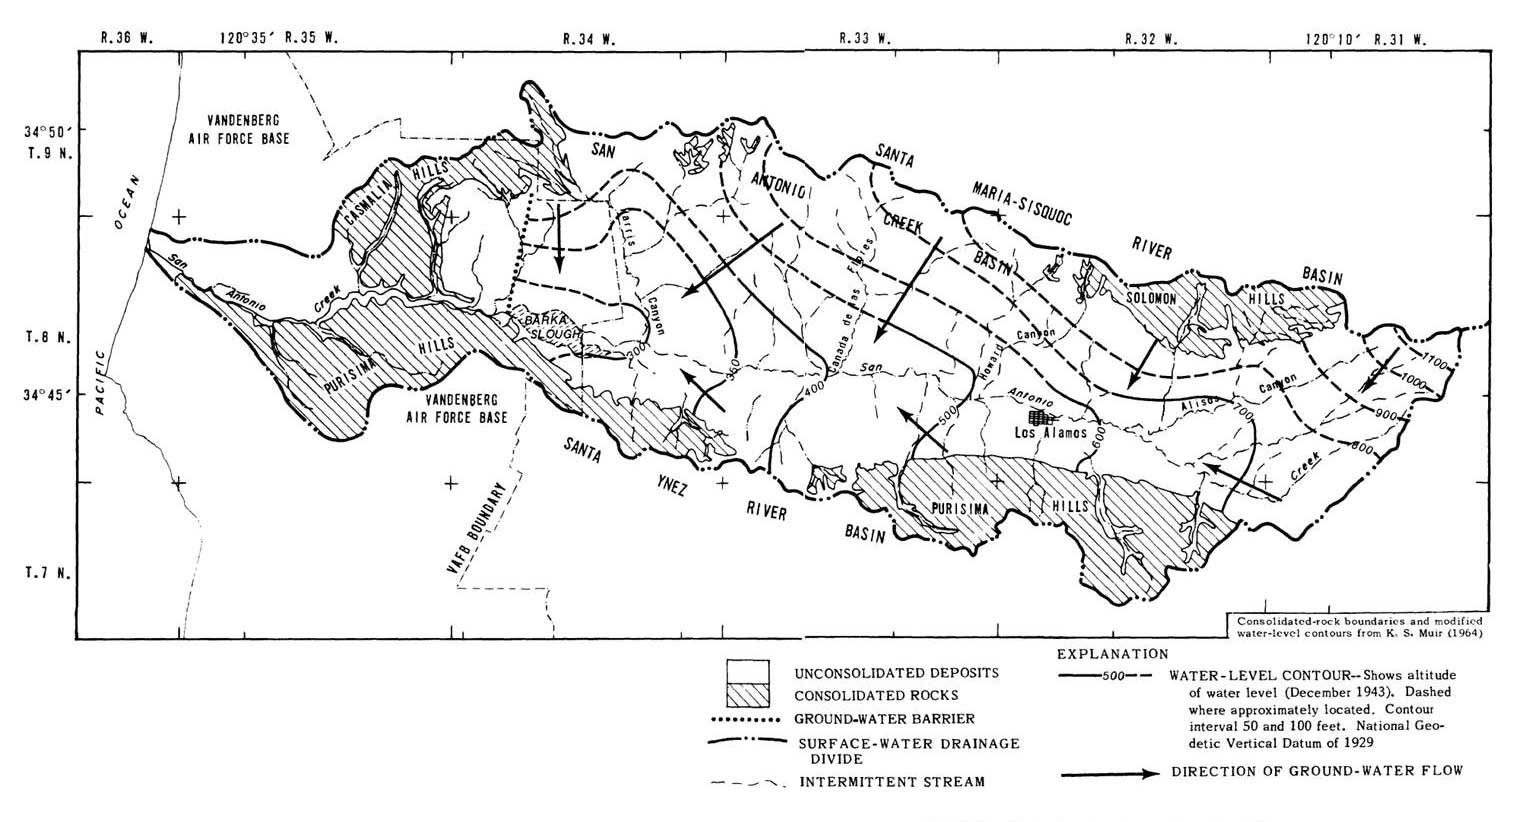
This December 1943 water-level contour map of the San Antonio Creek Valley shows the regional direction of groundwater movement, prior to significant groundwater development, is toward the center of the Valley and ultimately to the west toward the Barka Slough. Source: Martin, Peter, 1985)
San Antonio Creek Groundwater Level Data
Real-Time Water-Level Data
The USGS Real Time Groundwater Level Network contains water levels and well information from wells with "near real-time" data transmission instrumentation. Real-time data from wells in the San Antonio Creek Valley are recorded using automated submersible pressure transducers at 15-minute intervals. Data are stored onsite, and then transmitted to USGS offices every hour via satellite uplink. Data are available for public viewing within minutes of arrival. All real-time data are provisional and subject to revision. More real-time water levels will become available as additional wells come online. Wells with continuous time-series data from automated water-level recorders in the study area are shown on the map below.
Real-time groundwater-level monitoring sites in the San Antonio Creek Valley. Map image is the intellectual property of Esri and is used herein under license.
Dedicated Monitoring Sites
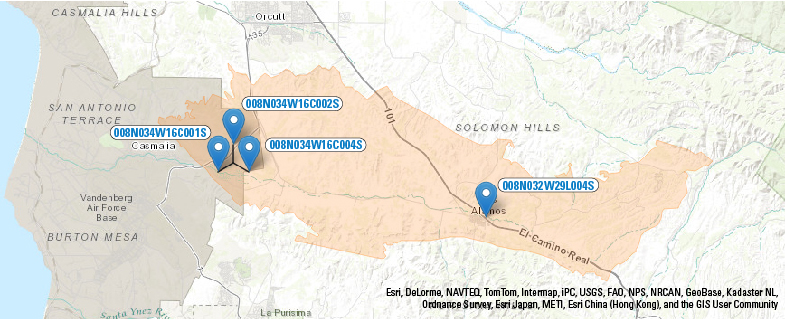
Developing a better understanding of the integrated hydrologic system will require the collection of depth-dependent and/or aquifer-dependent geohydrologic and geochemical data. The existing monitoring network, maintained by Santa Barbara County and the USGS to collect water-quality and water-level information, has been enhanced by the installation of dedicated monitoring sites. Dedicated monitoring sites include 8 water-table monitoring wells and two multiple-well monitoring sites installed in 2015 and 2016.
Map of USGS groundwater monitoring well sites in the San Antonio Creek study area. Map image is the intellectual property of Esri and is used herein under license.
Water-Table Monitoring Well Sites
In order to monitor the top of the saturated zone and to measure how quickly groundwater moves vertically through the unsaturated zone from land surface to the aquifer, several shallow (65- to 120-feet deep) 2-inch diameter groundwater wells were installed near stream-gaging stations and/or deep wells. These paired wells will measure vertical differences in groundwater hydraulic potential throughout the study area.
Water-tablemonitoring well sites include:
| Well Site Abbreviation | Well Site Name | Screened Depth | Composite Logs and Well Construction (.pdf) | Lithology Log (.pdf) | Geophysical Log (.las) |
|---|---|---|---|---|---|
| SAHC | San Antonio Creek – Harris Creek | 70-90 feet | Download | Download | Download |
| SASA | San Antonio Creek – San Antonio Road East | 45-65 feet | Download | Download | Download |
| SAGR | San Antonio Creek – Graciosa Road | 70-90 feet | Download | Download | Download |
| SAHG | San Antonio Creek – Harris Grade | 55-75 feet | Download | Download | Download |
| SACR#5 | San Antonio Creek – Old Careaga Ranch Road, Well #5 | 90-110 feet | Download | ||
| SALS | San Antonio Creek – Laguna Seca | 50-70 feet | Download | Download | Download |
| SACC#5 | San Antonio Creek – Cat Canyon, Well #5 | 100-120 feet | Download | Download | |
| SALA | San Antonio Creek – Los Alamos | 70-90 feet | Download | Download | Download |
Multiple-Well Monitoring Sites
In order to better understand the geologic, hydrologic, and chemical characteristics of the aquifer, particularly in the deeper part of the flow system, two multiple-well (nested) monitoring sites were installed. Four 2-inch diameter monitoring wells screened at different depths were installed at each site to collect data for evaluating vertical hydraulic-head gradients, aquifer properties, and water quality.
Multiple-well monitoring sites include:
| SACR#1-4 | San Antonio Creek – Old Careaga Ranch Road, Wells #1-4 |
|---|---|
| Well #1 | Screened: 670-690 feet |
| Well #2 | Screened: 520-540 feet |
| Well #3 | Screened: 330-350 feet |
| Well #4 | Screened: 200-220 feet |
| SACC#1-4 | San Antonio Creek – Cat Canyon, Wells #1-4 |
|---|---|
| Well #1 | Screened: 920-940 feet |
| Well #2 | Screened: 700-720 feet |
| Well #3 | Screened: 510-530 feet |
| Well #4 | Screened: 305-325 feet |

Typical construction of a multiple-well monitoring site installed using mud rotary drilling methods. Individual wells are installed in a single borehole. The screened interval of each well is surrounded by a sand pack. Seals are pressure grouted into place between screened zones to isolate the individual wells from each other. Each well provides depth-dependent water level and water chemistry data over the well's screened interval.
Periodic Water-Level Data
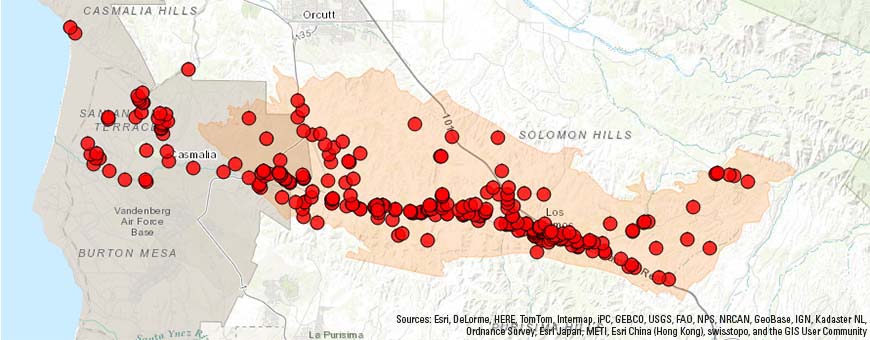
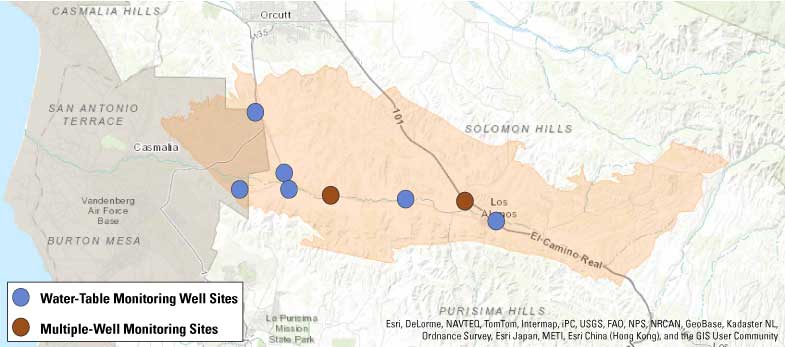
Groundwater-level monitoring sites in the San Antonio Creek study area with historical data. Map image is the intellectual property of Esri and is used herein under license.
Manually recorded historical water-level data from selected wells in the study area are archived by the USGS and are publicly available. Currently, the USGS manually measures water levels quarterly in more than 30 wells within or immediately adjacent to the San Antonio Creek Valley. During this study the number of wells measured will be increased and new monitoring wells will be installed and added to the network. Selected wells will be instrumented with pressure transducers to record hourly water levels. Periodic water-level data are available on the Interactive Map.
Cooperating Agencies

Santa Barbara County Water Agency
![]()
Related USGS Publications
Appraisal of Ground-Water Resources in the San Antonio Creek Valley
Geology and Ground Water of San Antonio Creek Valley, Santa Barbara County, California
Groundwater Quality in the South Coast Range Coastal Groundwater Basins, California
Other Related Publications
San Antonio Creek Coordinated Resource Management Plan
Ground Water Quality and Hydrology Data, San Antonio Creek Basin
Potential Effects of Increased Ground-Water Pumpage on Barka Slough, San Antonio Creek Valley