San Diego Hydrogeology
Referenced Digital Elevation Model (DEM) Datasets
 Each of the datasets are publicly available from the resources described below.
Digital Elevation Model (DEM) Datasets
1. 2013 NOAA Coastal California TopoBathy Merge Project
- Office for Coastal Management, National Ocean Service, National Oceanic and Atmospheric Administration, U.S. Department of Commerce, 2014,
- 2013 NOAA Coastal California TopoBathy Merge Project, raster digital dataset.
This project merged recently collected topographic, bathymetric, and acoustic elevation data along the entire California coastline from approximately the 10 meter elevation contour out to California's 3 mile state water's boundary.Topographic LiDAR:The topographic lidar data used in this merged project was the 2009-2011 CA Coastal Conservancy Lidar Project. The data were collected between October 2009 and August 2011. This collection was a joint effort by the NOAA Coastal Services Center (CSC); the California State Coastal Conservancy (SCC) Ocean Protection Council (OPC); Scripps Institution of Oceanography; and the Joint Airborne Lidar Bathymetry Technical Center of Expertise (JALBTCX). The data coverage extends landward 500 m from the shoreline, along the entire California coastline. The LAS classifications are as follows: 1-Unclassified, 2-Ground, 7-Noise, 9-Water, 10- Mudflats, 12-Overlap. The LAS points were manually re-classified from water and unclassified to ground in offshore areas where necessary.Bathymetric LiDAR: The bathymetric lidar data used in this merged project was 2009-2010 U.S. Army Corps of Engineers (USACE) Joint Airborne Lidar Bathymetry Center of Expertise (JALBTCX) lidar, provided by JALBTCX. The data were collected for the California Coastal Mapping Project (CCMP). The original data were in ASCII format and were converted to LAS v1.2. The LAS data were classified as follows: 21-Non-submerged Bathymetry, 22-Bathymetry, 23-Ignored Submerged Bathymetry/Overlap.Multibeam Acoustic Data: The acoustic data data used in this merged project were provided by the California Seafloor Mapping Program (CSMP) Ocean Protection Council and NOAA's National Geophysical Data Center (NGDC). The original data were in ASCII format and were converted to LAS v1.2. NOAA's VDatum software was used to vertically transform soundings from mean lower low water (MLLW) tidal datum to NAVD88 orthometric datum where necessary. The LAS data were classified as follows: 25-Submerged Acoustic, 26-Ignored Submerged Acoustic/Overlap.Upon receipt of the data, the NOAA Coastal Services Center (CSC) converted some of the classifications for data storage and Digital Coast provisioning purposes. The following are the classifications of data available from the NOAA Digital Coast: 1 - Unclassified, 2 - Ground, 7 - Low point (noise), 9 - Water, 11 - Bathymetry, 12 - Overlap, 13 - Submerged Acoustic, 14 - Non-Submerged Bathymetry, 15 - Ignored Submerged Bathymetry/Overlap, 16 - Ignored Submerged Acoustic/Overlap.
Data were retieved with the projection needed and we only retrieved the portion that we needed from this dataset to use in our study. Individual images were merged to create one dataset for our use.
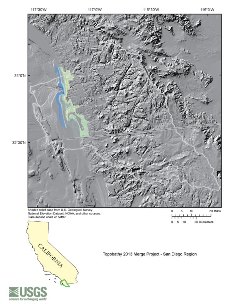
- Area used for study
- Documentation (PDF)
- Metadata - HTML, 19139 XML
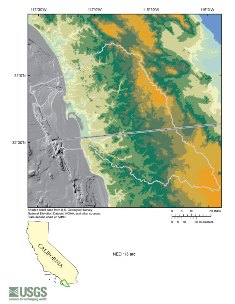
2. National Elevation Dataset 1/9 arc-second
- U.S. Geological Survey, 2012,
- USGS NED ned19_n32x50_w117x00_ca_mexico_2007 1/9 arc-second 2012 15 x 15 minute IMG, raster digital data accessed January 30, 2015.
- U.S. Geological Survey, 2012,
- USGS NED ned19_n32x50_w117x25_ca_mexico_2007 1/9 arc-second 2012 15 x 15 minute IMG, raster digital data accessed January 30, 2015.
- U.S. Geological Survey, 2012,
- USGS NED ned19_n32x75_w116x00_ca_mexico_2007 1/9 arc-second 2012 15 x 15 minute IMG, raster digital data accessed January 30, 2015.
- U.S. Geological Survey, 2012,
- USGS NED ned19_n32x75_w116x00_ca_mexico_lot2_2007 1/9 arc-second 2012 15 x 15 minute IMG, raster digital data accessed January 30, 2015.
- U.S. Geological Survey, 2012,
- USGS NED ned19_n32x75_w116x25_ca_mexico_2007 1/9 arc-second 2012 15 x 15 minute IMG, raster digital data accessed January 30, 2015.
- U.S. Geological Survey, 2012,
- USGS NED ned19_n32x75_w116x25_ca_mexico_lot2_2007 1/9 arc-second 2012 15 x 15 minute IMG, raster digital data accessed January 30, 2015.
- U.S. Geological Survey, 2012,
- USGS NED ned19_n32x75_w116x50_ca_mexico_2007 1/9 arc-second 2012 15 x 15 minute IMG, raster digital data accessed January 30, 2015.
- U.S. Geological Survey, 2012,
- USGS NED ned19_n32x75_w116x50_ca_mexico_lot2_2007 1/9 arc-second 2012 15 x 15 minute IMG, raster digital data accessed January 30, 2015.
- U.S. Geological Survey, 2012,
- USGS NED ned19_n32x75_w116x75_ca_mexico_2007 1/9 arc-second 2012 15 x 15 minute IMG, raster digital data accessed January 30, 2015.
- U.S. Geological Survey, 2012,
- USGS NED ned19_n32x75_w116x75_ca_mexico_lot2_2007 1/9 arc-second 2012 15 x 15 minute IMG, raster digital data accessed January 30, 2015.
- U.S. Geological Survey, 2012,
- USGS NED ned19_n32x75_w117x00_ca_mexico_2007 1/9 arc-second 2012 15 x 15 minute IMG, raster digital data accessed January 30, 2015.
- U.S. Geological Survey, 2012,
- USGS NED ned19_n32x75_w117x00_ca_mexico_lot2_2007 1/9 arc-second 2012 15 x 15 minute IMG, raster digital data accessed January 30, 2015.
- U.S. Geological Survey, 2009,
- USGS NED ned19_n32x75_w117x00_ca_sandiego_2005 1/9 arc-second 2009 15 x 15 minute IMG, raster digital data accessed January 30, 2015.
- U.S. Geological Survey, 2012,
- USGS NED ned19_n32x75_w117x25_ca_mexico_2007 1/9 arc-second 2012 15 x 15 minute IMG, raster digital data accessed January 30, 2015.
- U.S. Geological Survey, 2012,
- USGS NED ned19_n32x75_w117x25_ca_mexico_lot2_2007 1/9 arc-second 2012 15 x 15 minute IMG, raster digital data accessed January 30, 2015.
- U.S. Geological Survey, 2009,
- USGS NED ned19_n32x75_w117x25_ca_sandiego_2005 1/9 arc-second 2009 15 x 15 minute IMG, raster digital data accessed January 30, 2015.
- U.S. Geological Survey, 2009,
- USGS NED ned19_n32x75_w117x50_ca_sandiego_2005 1/9 arc-second 2009 15 x 15 minute IMG, raster digital data accessed January 30, 2015.
- U.S. Geological Survey, 2012,
- USGS NED ned19_n33x00_w116x00_ca_mexico_lot2_2007 1/9 arc-second 2012 15 x 15 minute IMG, raster digital data accessed January 30, 2015.
- U.S. Geological Survey, 2012,
- USGS NED ned19_n33x00_w117x00_ca_poway_2007 1/9 arc-second 2012 15 x 15 minute IMG, raster digital data accessed January 30, 2015.
- U.S. Geological Survey, 2009,
- USGS NED ned19_n33x00_w117x00_ca_sandiego_2005 1/9 arc-second 2009 15 x 15 minute IMG, raster digital data accessed January 30, 2015.
- U.S. Geological Survey, 2012,
- USGS NED ned19_n33x00_w117x25_ca_poway_2007 1/9 arc-second 2012 15 x 15 minute IMG, raster digital data accessed January 30, 2015.
- U.S. Geological Survey, 2009,
- USGS NED ned19_n33x00_w117x25_ca_sandiego_2005 1/9 arc-second 2009 15 x 15 minute IMG, raster digital data accessed January 30, 2015.
- U.S. Geological Survey, 2009,
- USGS NED ned19_n33x00_w117x50_ca_sandiego_2005 1/9 arc-second 2009 15 x 15 minute IMG, raster digital data accessed January 30, 2015.
- U.S. Geological Survey, 2011,
- USGS NED ned19_n33x25_w116x00_ca_saltonsea_2010 1/9 arc-second 2011 15 x 15 minute IMG, raster digital data accessed January 30, 2015.
- U.S. Geological Survey, 2010,
- USGS NED ned19_n33x25_w117x00_ca_poway_2007 1/9 arc-second 2012 15 x 15 minute IMG, raster digital data accessed January 30, 2015.
- U.S. Geological Survey, 2009,
- USGS NED ned19_n33x25_w117x00_ca_sandiego_2005 1/9 arc-second 2009 15 x 15 minute IMG, raster digital data accessed January 30, 2015.
- U.S. Geological Survey, 2012,
- USGS NED ned19_n33x25_w117x25_ca_poway_2007 1/9 arc-second 2012 15 x 15 minute IMG, raster digital data accessed January 30, 2015.
- U.S. Geological Survey, 2009,
- USGS NED ned19_n33x25_w117x25_ca_sandiego_2005 1/9 arc-second 2009 15 x 15 minute IMG, raster digital data accessed January 30, 2015.
- U.S. Geological Survey, 2011,
- USGS NED ned19_n33x50_w116x00_ca_saltonsea_2010 1/9 arc-second 2011 15 x 15 minute IMG, raster digital data accessed January 30, 2015.
- U.S. Geological Survey, 2011,
- USGS NED ned19_n33x50_w116x25_ca_saltonsea_2010 1/9 arc-second 2011 15 x 15 minute IMG, raster digital data accessed January 30, 2015.
- U.S. Geological Survey, 2012,
- USGS NED ned19_n33x50_w117x75_ca_orangeco_2011 1/9 arc-second 2012 15 x 15 minute IMG, raster digital data accessed January 30, 2015.
The National Elevation Dataset (NED) is the primary elevation data product of the USGS and serves as the elevation layer of The National Map. The NED provides basic elevation information for earth science studies and mapping applications in the United States. Scientists and resource managers use the NED data for global change research, hydrologic modeling, resource monitoring, mapping, visualization, and many other applications. The NED is updated continually to integrate newly available, improved elevation source data. All NED data are public domain.
This National Elevation Dataset has a 1/9 arc-second resolution (~3-meter cell size) and was retrieved in 15 minute blocks for the study area. The individual 15-minute blocks were merged together by region and then projected. For this study the primary areas of interest were the San Diego Bay and the United States and Mexico border regions. Areas extending into the ocean had to be removed from the dataset used since a value of zero was used instead of a empty data option. Our findings indicated the near shore values were not as accurate as other datasets so all values less than 2 meters NAVD88 were removed.
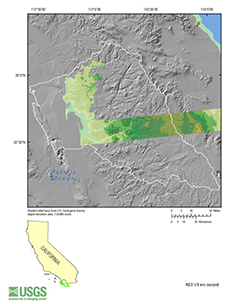
- Area used for study
- Documentation (PDF), NED Data Dictionary (PDF)
- Metadata
- ned19_n32x50_w117x00_ca_mexico_2007_meta - HTML, Text
- ned19_n32x50_w117x25_ca_mexico_2007_meta - HTML, Text
- ned19_n32x75_w116x00_ca_mexico_2007_meta - HTML, Text
- ned19_n32x75_w116x00_ca_mexico_lot2_2007_meta - HTML, Text
- ned19_n32x75_w116x25_ca_mexico_2007_meta - HTML, Text
- ned19_n32x75_w116x25_ca_mexico_lot2_2007_meta - HTML, Text
- ned19_n32x75_w116x50_ca_mexico_2007_meta - HTML, Text
- ned19_n32x75_w116x50_ca_mexico_lot2_2007_meta - HTML, Text
- ned19_n32x75_w116x75_ca_mexico_2007_meta - HTML, Text
- ned19_n32x75_w116x75_ca_mexico_lot2_2007_meta - HTML, Text
- ned19_n32x75_w117x00_ca_mexico_2007_meta - HTML, Text
- ned19_n32x75_w117x00_ca_mexico_lot2_2007_meta - HTML, Text
- ned19_n32x75_w117x00_ca_sandiego_2005_meta - HTML, Text
- ned19_n32x75_w117x25_ca_mexico_2007_meta - HTML, Text
- ned19_n32x75_w117x25_ca_mexico_lot2_2007_meta - HTML, Text
- ned19_n32x75_w117x25_ca_sandiego_2005_meta - HTML, Text
- ned19_n32x75_w117x50_ca_sandiego_2005_meta - HTML, Text
- ned19_n33x00_w116x00_ca_mexico_lot2_2007_meta - HTML, Text
- ned19_n33x00_w117x00_ca_poway_2007_meta - HTML, Text
- ned19_n33x00_w117x00_ca_sandiego_2005_meta - HTML, Text
- ned19_n33x00_w117x25_ca_poway_2007_meta - HTML, Text
- ned19_n33x00_w117x25_ca_sandiego_2005_meta - HTML, Text
- ned19_n33x00_w117x50_ca_sandiego_2005_meta - HTML, Text
- ned19_n33x25_w116x00_ca_saltonsea_2010_meta - HTML, Text
- ned19_n33x25_w117x00_ca_poway_2007_meta - HTML, Text
- ned19_n33x25_w117x00_ca_sandiego_2005_meta - HTML, Text
- ned19_n33x25_w117x25_ca_poway_2007_meta - HTML, Text
- ned19_n33x25_w117x25_ca_sandiego_2005_meta - HTML, Text
- ned19_n33x50_w116x00_ca_saltonsea_2010_meta - HTML, Text
- ned19_n33x50_w116x25_ca_saltonsea_2010_meta - HTML, Text
- ned19_n33x50_w117x75_ca_orangeco_2011_meta - HTML, Text
3. San Diego, California Coastal Digital Elevation Model
- Carignan, K.S., L.A. Taylor, B.W. Eakins, D.Z. Friday, P.R. Grothe, and M. Love, 2012,
- Digital Elevation Models of San Diego, California: Procedures, Data Sources and Analysis, NOAA National Geophysical Data Center technical report, Boulder, CO, 32 pp.
Available at http://www.ngdc.noaa.gov/dem/squareCellGrid/download/3543
NOAA's National Geophysical Data Center (NGDC) is building high-resolution digital elevation models (DEMs) for select U.S. coastal regions. These integrated bathymetric-topographic DEMs are used to support tsunami forecasting and warning efforts at the NOAA Center for Tsunami Research, Pacific Marine Environmental Laboratory (PMEL). The DEMs are part of the tsunami forecast system SIFT (Short-term Inundation Forecasting for Tsunamis) currently being developed by PMEL for the NOAA Tsunami Warning Centers, and are used in the MOST (Method of Splitting Tsunami) model developed by PMEL to simulate tsunami generation, propagation, and inundation. Bathymetric, topographic, and shoreline data used in DEM compilation are obtained from various sources, including NGDC, the U.S. National Ocean Service (NOS), the U.S. Geological Survey (USGS), the U.S. Army Corps of Engineers (USACE), the Federal Emergency Management Agency (FEMA), and other federal, state, and local government agencies, academic institutions, and private companies. DEMs are referenced to the vertical tidal datum of North American Vertical Datum of 1988 (NAVD 88) or Mean High Water (MHW) and horizontal datum of World Geodetic System 1984 (WGS84). Cell size for the DEMs ranges from 1/3 arc-second (~10 meters) to 3 arc-seconds (~90 meters).
This dataset was a well refined land and ocean elevation model off shore from San Diego. This dataset matched well with our other detailed data. The DEM borders Mexico to the south and extends north to Laguna Beach, California with a 1/3 arc-second (~10 meter) resolution. This dataset was retrieved as one complete ASCII grid which was then projected to the study datum and projection.
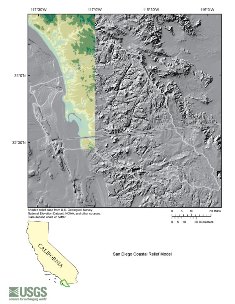
- Area used for study
- Documentation (PDF)
- Metadata - HTML, 19139 XML
4. National Elevation Dataset 1/3 arc-second
- U.S. Geological Survey, 2013,
- USGS NED n33w116 1/3 arc-second 2013 1 x 1 degree ArcGrid, raster digital data accessed January 27, 2015.
- U.S. Geological Survey, 2013,
- USGS NED n33w117 1/3 arc-second 2013 1 x 1 degree ArcGrid, raster digital data accessed January 27, 2015.
- U.S. Geological Survey, 2013,
- USGS NED n33w118 1/3 arc-second 2013 1 x 1 degree ArcGrid, raster digital data accessed January 27, 2015.
- U.S. Geological Survey, 2013,
- USGS NED n34w116 1/3 arc-second 2013 1 x 1 degree ArcGrid, raster digital data accessed January 27, 2015.
- U.S. Geological Survey, 2013,
- USGS NED n34w117 1/3 arc-second 2013 1 x 1 degree ArcGrid, raster digital data accessed January 27, 2015.
- U.S. Geological Survey, 2013,
- USGS NED n34w118 1/3 arc-second 2013 1 x 1 degree ArcGrid, raster digital data accessed January 27, 2015.
The National Elevation Dataset (NED) is the primary elevation data product of the USGS and serves as the elevation layer of The National Map. The NED provides basic elevation information for earth science studies and mapping applications in the United States. Scientists and resource managers use the NED data for global change research, hydrologic modeling, resource monitoring, mapping, visualization, and many other applications. The NED is updated continually to integrate newly available, improved elevation source data. All NED data are public domain.
The National Elevation Dataset 1/3 arc-second resolution was used to complete the DEM for the land-based portion of the San Diego Hydrogeology study. This dataset extends into Mexico and utilizes the best data available as one complete and seamless DEM. This dataset was retrieved in 1 degree blocks for the study area. The blocks were merged together and then projected in to the projection used for the study. All data less than 2 meters NAVD88 were removed in the ocean area of the dataset.
5. U.S. Coastal Relief Model - Southern California vers. 1, 3 arc-second resolution
- NOAA National Geophysical Data Center,
- U.S. Coastal Relief Model, accessed 8/10/2015, http://www.ngdc.noaa.gov/mgg/coastal/crm.html.
NGDC's U.S. Coastal Relief Model (CRM) provides a comprehensive view of the U.S. coastal zone integrating offshore bathymetry with land topography into a seamless representation of the coast. The CRM spans the U.S. East and West Coasts, the northern coast of the Gulf of Mexico, Puerto Rico, and Hawaii, reaching out to, and in places even beyond, the continental slope. Bathymetric and topographic data sources include: NGDC's NOS hydrographic surveys and multibeam bathymetry; the U.S. Geological Survey (USGS); and other federal government agencies and academic institutions. Bathymetric contours from the International Bathymetric Chart of the Caribbean Sea and the Gulf of Mexico project were also used. Digital elevation models (DEMs) of the Great Lakes, Southern Alaska, and high-resolution DEMs of U.S. coastal communities and territories are also available.
Dataset was used to complete the primary portion of the ocean included in the study area. This dataset was available in 3 arc-second resolution.
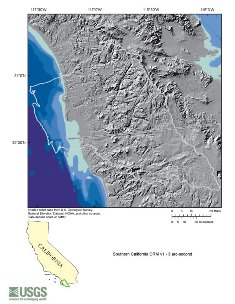
- Area used for study
- Metadata - HTML, XML
Project Chief: Wes Danskin
Phone: 619-225-6132
Email: wdanskin@usgs.gov
Welcome to the United States Geological Survey (USGS) San Diego Hydrogeology (SDH) project website, which provides geologic and hydrologic information for the transboundary San Diego–Tijuana area, USA and Mexico. This website provides background information about the project; a variety of news items; a large amount of data, in particular for USGS multiple-depth, monitoring-well sites; geologic and hydrologic models; and additional resources including photos, illustrations, and references.
Last updated: July 2023.
Some additional data may be available from the USGS database National Water Information System (NWIS).
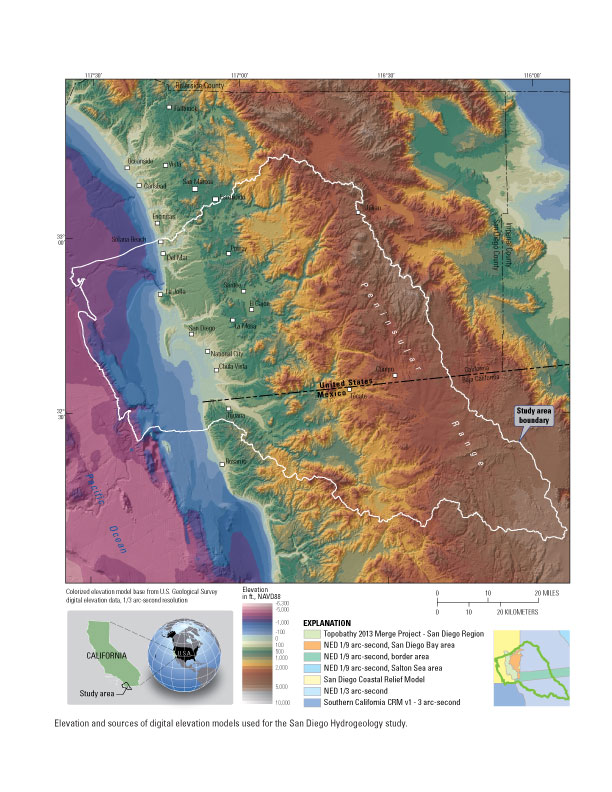
Questions about San Diego Hydrogeology? Please contact Wes Danskin (email: wdanskin@usgs.gov or send a letter). 619.225.6132