
U.S. Geological Survey Open-File Report 96-629
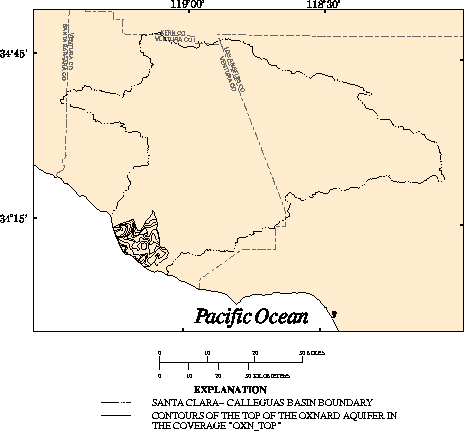
Description:        Elevation contours of the top of the Oxnard aquifer.

Data type:          POLYGON and LINE.

Source:             Modified from:
                    California Department of Water Resources, 1975b, Lines of
                    equal elevation on the top of the upper aquifer system:
                    California Department of Water Resources, Southern
                    District, Water Resources Management, pl. 1.

Source scale:       1:63,360

Source projection:  Unknown.

Method of entry:    Contour lines were manually digitized from mylar source
                    maps using an Altek Datatab AC40 digitizing tablet,
                    which has a resolution of 0.002 inch. The geographic
                    features and control points (points of known coordinate
                    locations) were digitized and transformed into real- world
                    coordinates.

Quality control:    The coverage was plotted and compared with the source maps.

Projection of data: Universal Transverse Mecator projection: Zone 11, Y-shift
                    -3.5 million meters.

Final update:       May 1994

Description
of variables:       OXN_TOP polygon attribute table.

Variable   Type     Length  Definition

ELEVATION  Integer  6       Average elevation, in feet, referenced to sea level.


Description
of variables:       OXN_TOP line attribute table.


Variable   Type     Length  Definition

ELEVATION  Integer  6       Lines of equal elevation, in feet, referenced to
                              sea level.
Description: Elevation contours of the bottom of the Oxnard aquifer.
Data type: POLYGON and LINE.
Source: Modified from:
Ventura County, 1978, 208 Seawater Intrusion Study, Ventura
County: Generalized lines of equal elevation on the base of
the Oxnard aquifer zone: Ventura County, Calif., 1 sheet.
Source scale: 1:63,360
Source projection: Unknown.
Method of entry: Contour lines were manually digitized from mylar source
maps using an Altek Datatab AC40 digitizing tablet, which
has a resolution of 0.002 inch. The geographic features and
control points (points of known coordinate locations) were
digitized and transformed into real-world coordinates.
Quality control: The coverage was plotted and compared with the source maps.
Projection of data: Universal Transverse Mecator projection: Zone 11, Y-shift
-3.5 million meters.
Final update: May 1994
Description
of variables: OXN_BOT polygon attribute table.
Variable Type Length Definition
ELEVATION Integer 6 Average elevation, in feet, referenced to sea level.
Description
of variables: OXN_BOT line attribute table.
Variable Type Length Definition
ELEVATION Integer 6 Lines of equal elevation, in feet, referenced
to sea level.
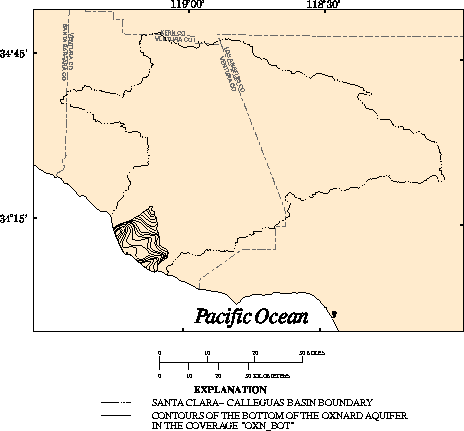
Figure 20. Elevation contours of the bottom of the Oxnard aquifer.
MUGU_TOP
Description: Elevation contours of the top of the Mugu aquifer.
Data type: LINE and POLYGON.
Source: Modified from:
Turner, John M., 1975, Groundwater management plan: Lines
of equal elevation on the top of the Mugu aquifer: County
of Ventura, Public Works Agency, Flood Control and Water
Resources Department, Fox Canyon Groundwater Management
Agency, pl. 1.
Source scale: 1:63,360
Source projection: Unknown.
Method of entry: Contour lines were manually digitized from mylar source
maps using an Altek Datatab AC40 digitizing tablet, which
has a resolution of 0.002 inch. The geographic features
and control points (points of known coordinate locations)
were digitized and transformed into real- world
coordinates.
Quality control: The coverage was plotted and compared with the source maps.
Projection of data: Universal Transverse Mecator projection: Zone 11, Y-shift
-3.5 million meters.
Final update: May 1994
Description
of variables: MUGU_TOP polygon attribute table.
Variable Type Length Definition
ELEVATION Integer 6 Average elevation, in feet, referenced to sea level.
Description
of variables: MUGU_TOP [line] attribute table.
Variable Type Length Definition
ELEVATION Integer 6 Lines of equal elevation, in feet, referenced to
sea level.
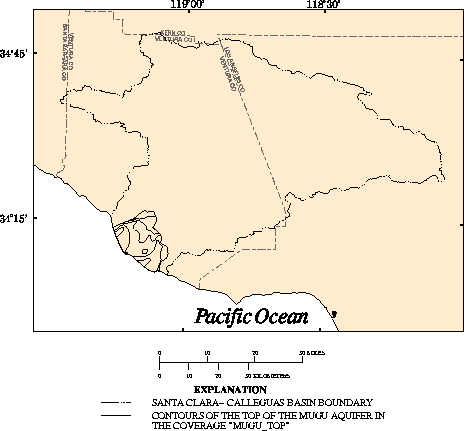
Figure 21. Elevation contours of the top of the Mugu aquifer.
MUGU_BOT
Description: Elevation contours of the bottom of the Mugu aquifer.
Data type: POLYGON and LINE.
Source: Modified from:
Turner, John M., 1975, Groundwater management plan: Lines
of equal elevation on the bottom of the Mugu aquifer:
County of Ventura, Public Works Agency, Flood Control and
Water Resources Department, Fox Canyon Groundwater
Management Agency, pl. 2.
Source scale: 1:63,360
Source projection: Unknown.
Method of entry: Contour lines were manually digitized from a mylar source
map using an Altek Datatab AC40 digitizing tablet, which
has a resolution of 0.002 inch. The geographic features and
control points (points of known coordinate locations) were
digitized and transformed into real-world coordinates.
Quality control: The coverage was plotted and compared with the source map.
Projection of data: Universal Transverse Mecator projection: Zone 11, Y-shift
-3.5 million meters.
Final update: May 1994
Description
of variables: MUGU_BOT polygon attribute table.
Variable Type Length Definition
ELEVATION Integer 6 Average elevation, in feet, referenced to sea level.
Description
of variables: MUGU_BOT line attribute table.
Variable Type Length Definition
ELEVATION Integer 6 Lines of equal elevation, in feet, referenced to
sea level.
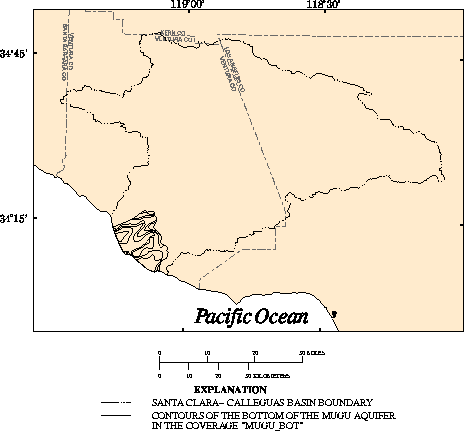
Figure 22. Elevation contours of the bottom of the Mugu aquifer.
LAS_TOP
Description: Elevation contours of the top of the lower aquifer system.
Data type: POLYGON and LINE.
Source: Modified from:
Turner, John M., 1975, Groundwater management plan: Lines
of equal elevation on the top of the lower aquifer system:
County of Ventura, Public Works Agency, Flood Control and
Water Resources Department, Fox Canyon Groundwater
Management Agency, p l. 4.
Source scale: 1:63,360
Source projection: Unknown.
Method of entry: Contour lines were manually digitized from a mylar source
map using an Altek Datatab AC40 digitizing tablet, which
has a resolution of 0.002 inch. The geographic features and
control points (points of known coordinate locations) were
digitized and transformed into realworld coordinates.
Quality control: The coverage was plotted and compared with the source map.
Projection of data: Universal Transverse Mecator projection: Zone 11, Y-shift
-3.5 million meters.
Final update: May 1994
Description
of variables: FOX_TOP polygon attribute table.
Column Type Length Definition
ELEVATION Integer 6 Average elevation, in feet, referenced to sea level.
Description
of variables: FOX_TOP line attribute table.
Column Type Length Definition
ELEVATION Integer 6 Lines of equal elevation, in feet, referenced to
sea level.
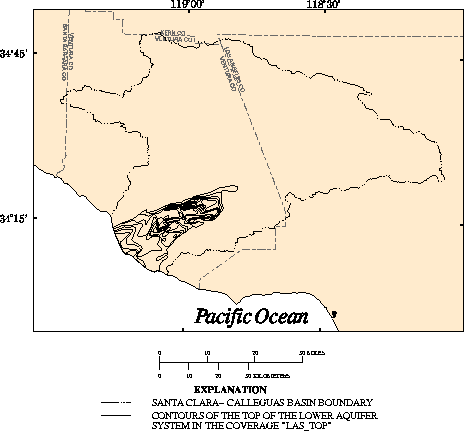
Figure 23. Elevation contours of the top of the lower aquifer system.
LAS_BOT
Description: Elevation contours of the base of the ground-water system.
Data type: POLYGON and LINE.
Source: Modified from:
Turner, John M., 1975, Groundwater management plan: Lines
of equal elevation on the base of the ground-water system:
County of Ventura, Public Works Agency, Flood Control and
Water Resources Department, Fox Canyon Groundwater
Management Agency, p l. 5.
Source scale: 1:63,360
Source projection: Unknown.
Method of entry: Contour lines were manually digitized from a mylar source
map using an Altek Datatab AC40 digitizing tablet, which
has a resolution of 0.002 inch. The geographic features and
control points (points of known coordinate locations) were
digitized and transformed into realworld coordinates.
Quality control: The coverage was plotted and compared with the source map.
Projection of data: Universal Transverse Mecator projection: Zone 11, Y-shift
-3.5 million meters.
Final update: May 1994
Description
of variables: FOX_BOT polygon attribute table.
Variable Type Length Definition
ELEVATION Integer 6 Average elevation, in feet, referenced to sea level.
Description
of variables: FOX_BOT line attribute table.
Variable Type Length Definition
ELEVATION Integer 6 Lines of equal elevation, in feet, referenced to
sea level.
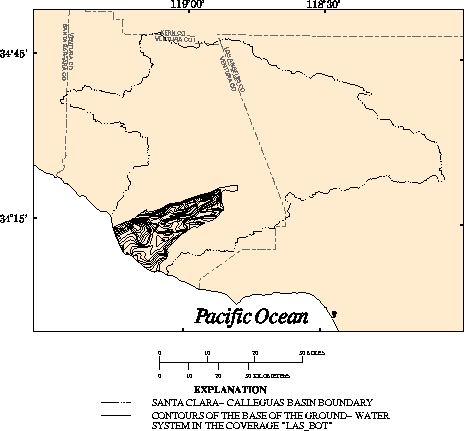
Figure 24. Elevation contours of the base of the ground-water system.
BATHY
Description: Offshore bathymetry.
Data type: LINE.
Source: Modified from:
Greene, H.G., Wolf, S.C., and Blom, K.G., 1978, The marine
geology of the eastern Santa Barbara Channel, with
particular emphasis on the ground-water basins offshore
from the Oxnard Plain, Southern California: U.S. Geological
Survey Open-File Report 78-305, 104 p., pl. 2.
Source scale: 1:62,500
Source projection: California Coordinate System, zone 5.
Method of entry: Bathymetry lines were manually digitized from a paper
source map using an Altek Datatab AC40 digitizing tablet,
which has a resolution of 0.002 inch. The geographic
features and control points (points of known coordinate
locations) were digitized and transformed into real-world
coordinates.
Quality control: The coverage was plotted and compared with the source map.
Projection
of data: Universal Transverse Mecator projection: Zone 11, Y-shift
-3.5 million meters.
Final update: July 11, 1991
Description
of variables: BATHY line attribute table.
Variable Type Length Definition
METERS Floating 8 Bathymetric contours, in meters.
decimal
FEET Floating 8 Bathymetric contours, in feet, as calculated from
decimal meters.
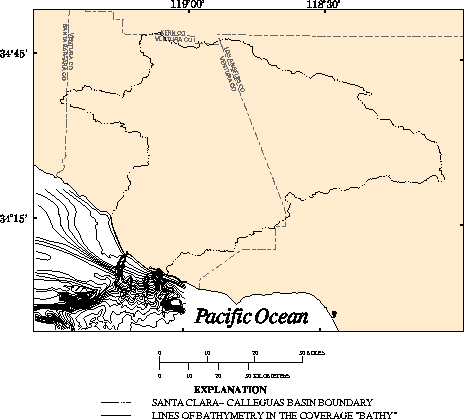
Figure 25. Offshore bathymetry.
FAULTS
Description: Selected faults.
Data type: LINE.
Source: Modified from:
(a) Weber, F.H., Kiessling, E.W., Sprotte, E.C., Johnson,
J.A., Sherburne, R.W., and Cleveland, G.B., 1976, Seismic
hazards study of Ventura County, California: California
Department of Conservation, California Division of Mines
and Geology Open- File Report 76-5, 396 p., pls. 3A and 3B.
(b) Greene, H.G., Wolf, S.C., and Blom, K.G., 1978, The
marine geology of the eastern Santa Barbara Channel, with
particular emphasis on the ground-water basins offshore
from the Oxnard Plain, Southern California: U.S. Geological
Survey Open-File Report 78-305, 104 p., pl. 2.
Source scale: (a) 1:48,000 (b) 1:62,500
Source projection: (a) California Coordinate System, zone 5.
(b) California Coordinate System, zone 5.
Method of entry: Fault lines were manually digitized from paper source maps
using an Altek Datatab AC40 digitizing tablet, which has a
resolution of 0.002 inch. The geographic features and
control points (points of known coordinate locations) were
digitized and transformed into real-world coordinates.
Quality control: The coverage was plotted and compared with the source maps.
Projection of data: Universal Transverse Mecator projection: Zone 11, Y-shift
-3.5 million meters.
Final update: September 1, 1992
Description
of variables: FAULTS line attribute table.
Variable Type Length Definition
CODE Integer 4 Unique number for each fault trace.
TYPE Character 16 Description of fault trace.
SYMBOL Integer 4 Number used to assign a line color.
NAME Character 20 Published name of fault trace.
SOURCE Character 6 Abbreviated source for fault trace.
LOCATION Character 9 Identifies fault as onshore or offshore.
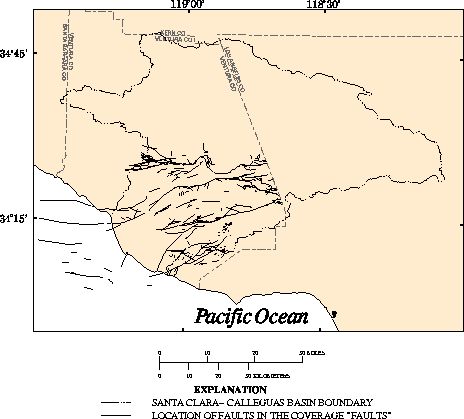
Figure 26. Selected faults.
FOLDS
Description: Selected synclines, anticlines, and monoclines.
Data type: LINE.
Source: Modified from:
Greene, H.G., Wolf, S.C., and Blom, K.G., 1978, The marine
geology of the eastern Santa Barbara Channel, with
particular emphasis on the ground-water basins offshore
from the Oxnard Plain, Southern California: U.S. Geological
Survey Open-File Report 78-305, 104 p., pl. 2.
Source scale: 1: 62,500
Source projection: Polyconic.
Method of entry: Synclines, anticlines, and monocline lines were manually
digitized from a mylar source map using an Altek Datatab
AC40 digitizing tablet, which has a resolution of 0.002
inch. The geographic features and control points (points of
known coordinate locations) were digitized and transformed
into real-world coordinates.
Quality control: The coverage was plotted and compared with the the source
map.
Projection of data: Universal Transverse Mecator projection: Zone 11, Y-shift
-3.5 million meters.
Final update: September 1, 1991
Description
of variables: FOLDS line attribute table.
Variable Type Length Definition
CODE Integer 4 Unique number for each syncline, anticline, and
monocline trace.
NAME Character 21 Identifies feature as "observed," "inferred," or
"concealed."
SYMBOL Integer 4 Number used to assign a line color.
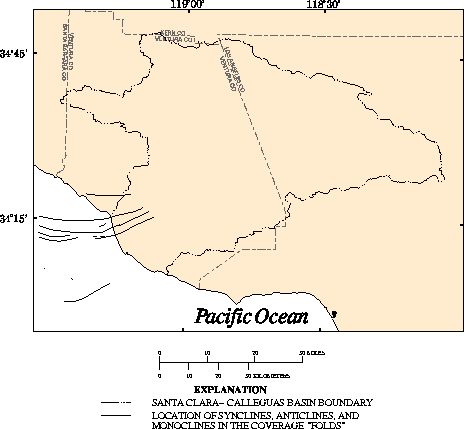
Figure 27. Selected synclines, anticlines, and monoclines.
GEOLOGY
Description: Selected surficial geology.
Data type: POLYGON.
Source: Modified from:
(a) Weber, F.H., Kiessling, E.W., Sprotte, E.C., Johnson,
J.A., Sherburne, R.W., and Cleveland, G.B., 1976, Seismic
hazards study of Ventura County, California: California
Department of Conservation, California Division of Mines
and Geology Open-File Report 76-5, 396 p., pls. 3A and 3B.
(b) Greene, H.G., and Kennedy, M.P., 1987, Geology of the
California Continental Margin: Explanation of the
California Continental Margin Geologic Map Series--
interpretive methods, symbology, stratigraphic units and
bibliography: area 2, California Continental Margin
Geologic Map Series, Mid-Southern California Continental
Margin: U.S. Geological Survey Bulletin 207, pl. 2A.
Source scale: (a) 1:48,000 (b) 1:62,500
Source projection: (a) California Coordinate System, zone 5.
(b) California Coordinate System, zone 5.
Method of entry: Geology polygons were manually digitized from paper source
maps using an Altek Datatab AC40 digitizing tablet, which
has a resolution of 0.002 inch. The geographic features and
control points (points of known coordinate locations) were
digitized and transformed into real- world coordinates.
Quality control: The coverage was plotted and compared with the source maps.
Projection of data: Universal Transverse Mecator projection: Zone 11, Y-shift
-3.5 million meters.
Final update: June 30, 1992
Description
of variables: GEOLOGY polygon attribute table.
Variable Type Length Definition
CODE1 Integer 2 Unique number for each degree of consolidation.
NAME1 Character 15 Degree of consolidation.
CODE2 Integer 3 Unique number for each stratigraphic designation.
NAME2 Character 28 Stratigraphic designation.
LOCATION Character 9 Location of feature.
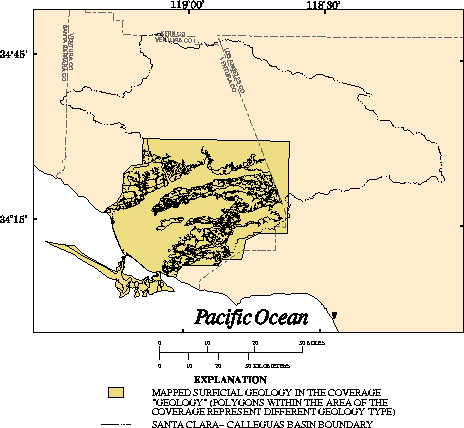
Figure 28. Selected surficial geology.
SOILS
Description: Selected soils.
Data type: POLYGON.
Source: Modified from:
U.S. Department of Agriculture, Soil Conservation Service,
1970, Soil survey of Ventura area, California. (Soil maps
on orthophoto series taken in 1959 and 1965.)
Source scale: 1:24,000
Source projection: California Coordinate System, zone 5.
Method of entry: Soil polygons and control points (points of known
coordinate locations) were scanned from paper source maps
with a Contex high resolution scanner and vectorized using
Cadcore software. The vectorized data were output in
DXF-file format, converted to a coverage, and transformed
into real-world coordinates.
Quality control: The coverage was plotted and compared with the source maps.
Projection of data: Universal Transverse Mecator projection: Zone 11, Y-shift
-3.5 million meters.
Final update: June 30, 1991
Description
of variables: SOILS polygon attribute table.
Variable Type Length Definition
SOILT Character 5 Name of each individual soil type.
CLASS Binary 2 Code describing relative permeability of the
different types.
SHADE Binary 2 Number used to assign a fill color.
HYDRO Character 2 Four hydrologic soil groups that are based on soil
properties that influence runoff.
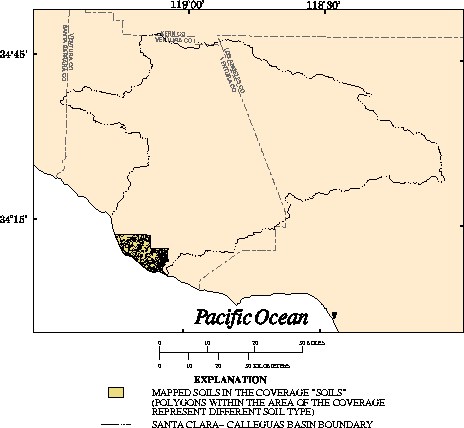
Figure 29. Selected soils.
Next-Hydrology
BACK TO: