Mojave Groundwater Resources
1999 - 2004 Mojave Region Land-Subsidence Study
LAND-SUBSIDENCE STUDIES IN THE MOJAVE RIVER AND MORONGO GROUNDWATER BASINS by Michelle Sneed and J.T. Brandt
For this study, SAR data from the European Space Agency's (ESA) ENVISAT and European Earth Remote Sensing II (ERS-2) satellites were used to map and measure displacement. The two satellites are side-looking, orbit the Earth at an altitude of approximately 500 mi (800 km), and have 35-day repeat cycles. Ten interferograms with temporal baselines ranging from 70 days to 18 months were developed for this study using 10 synthetic aperture radar (SAR) scenes acquired by the ERS-2 satellite, and 16 interferograms with time periods ranging from 35 days to 14 months were developed for this study using 22 synthetic aperture radar (SAR) scenes acquired by the European ENVISAT satellite.
About one half of the interferograms that covered the study area were either not coherent enough to analyze, were contaminated by atmospheric artifacts, or were dominated by the Hector Mine Earthquake in October 1999. The remaining interferograms show that deformation occurred in the same areas as reported Sneed and others (2003): Harper Lake area (for example 06/05/1999 to 12/16/2000 contours), Newberry Springs (for example, 11/30/2003 to 5/23/2004), Lucerne Valley (for example, 11/08/1999 to 11/27/2000 contours), and the El Mirage Lake area (for example, 06/05/1999 to 12/16/2000); the maximum deformation values from each area are presented in InSAR Results. Because the location of maximum deformation often differed for each interferogram, the values presented in InSAR Results from adjacent time periods for each area cannot be combined.
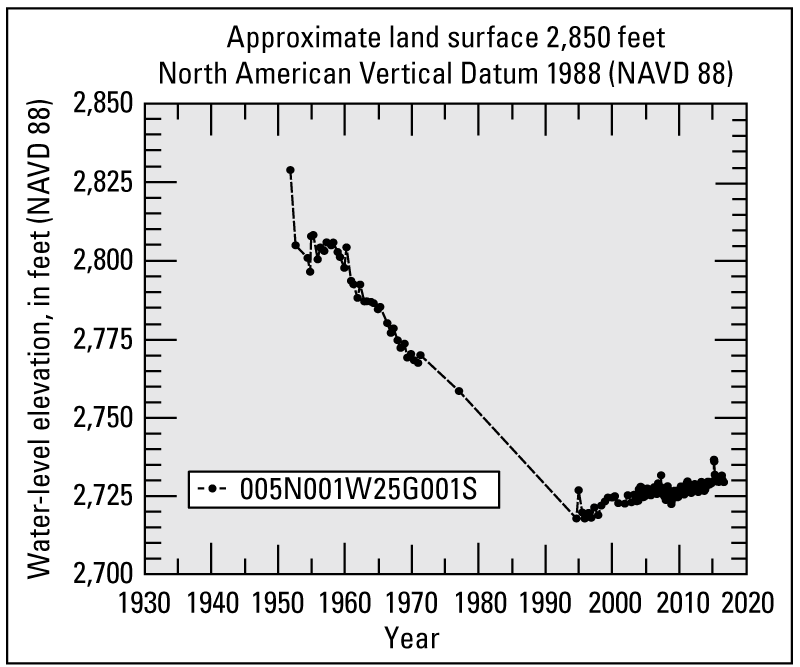
Subsidence occurred in the El Mirage area and near the northeastern shore of Harper Lake between May 1999 and December 2000. Water levels from wells in both of these areas show a general decline during that time period. Subsidence also occurred in Lucerne Valley between May 1999 and December 2000, and between June 2003 and September 2004. However, the hydrograph for well 5N/1W-25G1 shows that water levels increased owing to a decrease in pumpage (Jill Densmore, U.S. Geological Survey, written commun., 2006). The incongruity between the subsidence and water-level increases measured in this area likely is due to the lag in the concomitant compaction, which is discussed in the above section “Mechanics of Land Subsidence”. Between June 2004 and November 2004, subsidence also occurred in Newberry Springs (InSAR Results), but the interferograms for other time periods indicate a mix of deformation (for example, 10/26/2003 to 11/14/2004); some areas had uplift and other areas had no change.
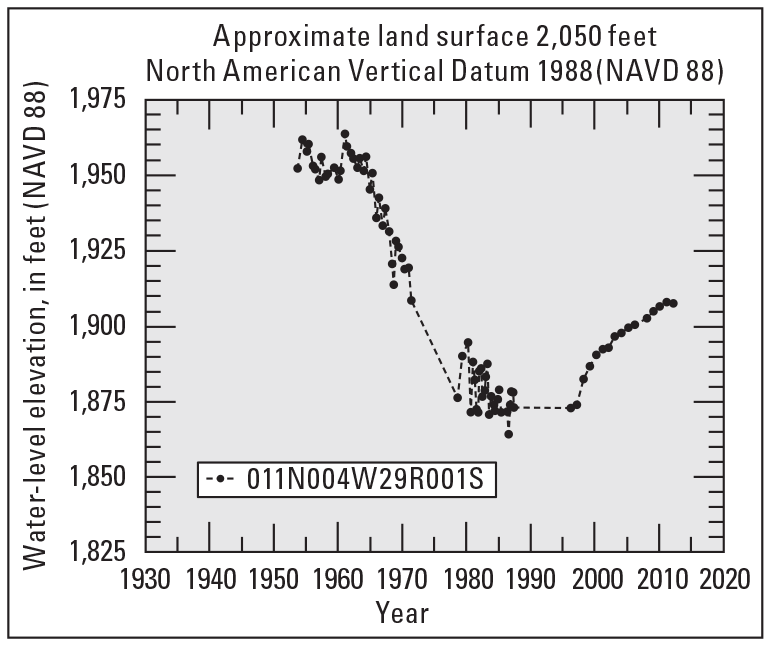
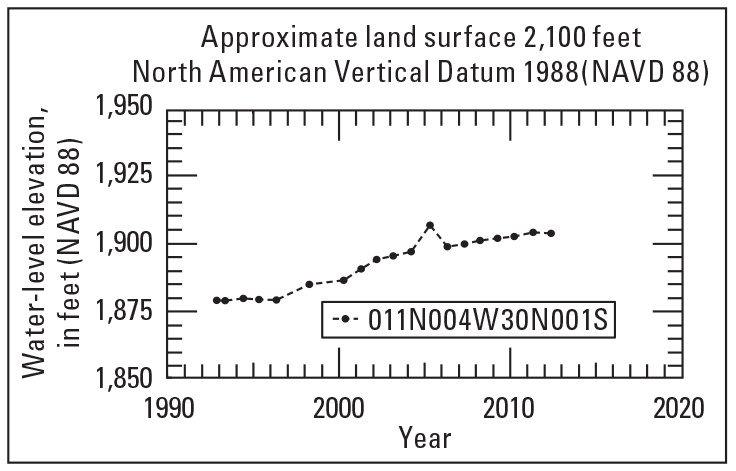
Uplift occurred mainly in the southwestern shore of Harper Lake (InSAR Results; for example, 05/20/2000 to 12/16/2000) where water-level hydrographs (well 011N004W29R001S and well 011N004W30N001S) show a steady increase in water levels owing to the reduction in pumpage since about 1990 (Stamos and others, 2001).
Mojave Region Maps
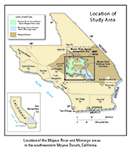
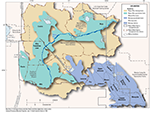
General Location
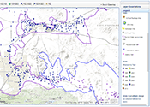
Detailed Location Map
Interactive Data Map
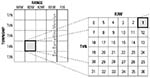
Well-Numbering System

To view PDF documents, you must have Adobe Reader installed on your computer.