San Bernardino Optimal Basin Management
Understanding Complex Models Using Visualization: San Bernardino Valley Groundwater Basin, Southern California
Zhen Li and Wesley R. Danskin U.S. Geological Survey, zhenli@usgs.gov, wdanskin@usgs.gov, San Diego, California, USA
Complete accessible text of report (726 KB PDF)
To view PDF documents, you must have the Adobe Acrobat Reader (free from Adobe Systems) installed on your computer.
(download free copy of Acrobat Reader).
Abstract
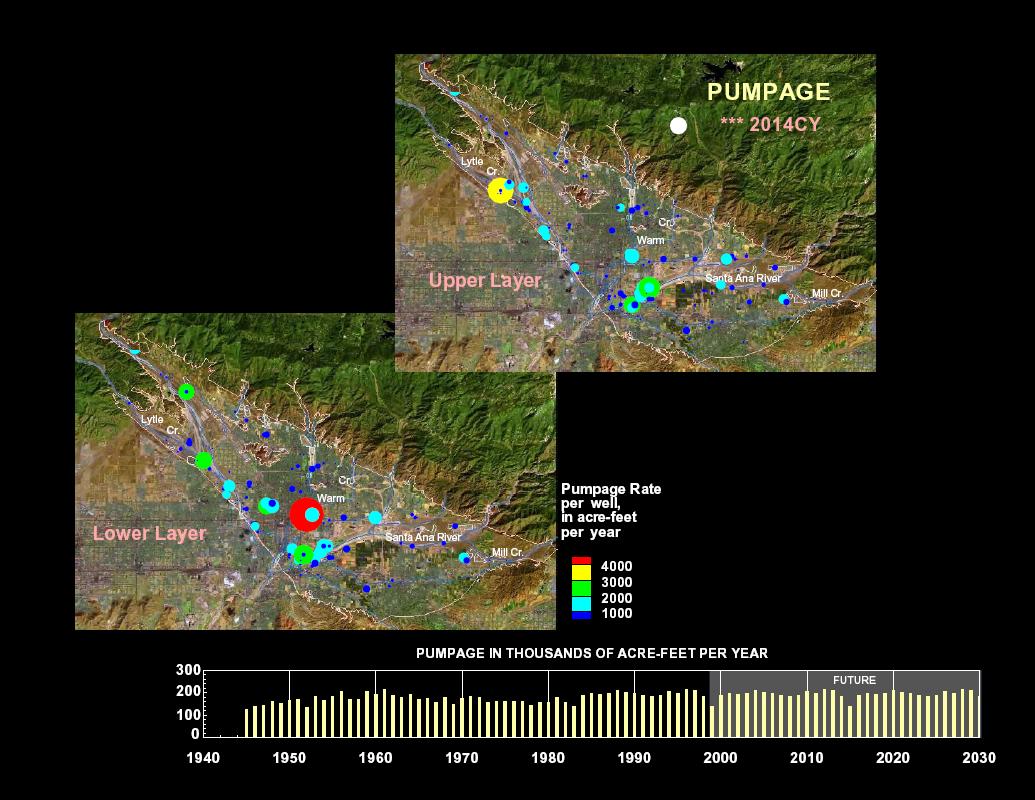
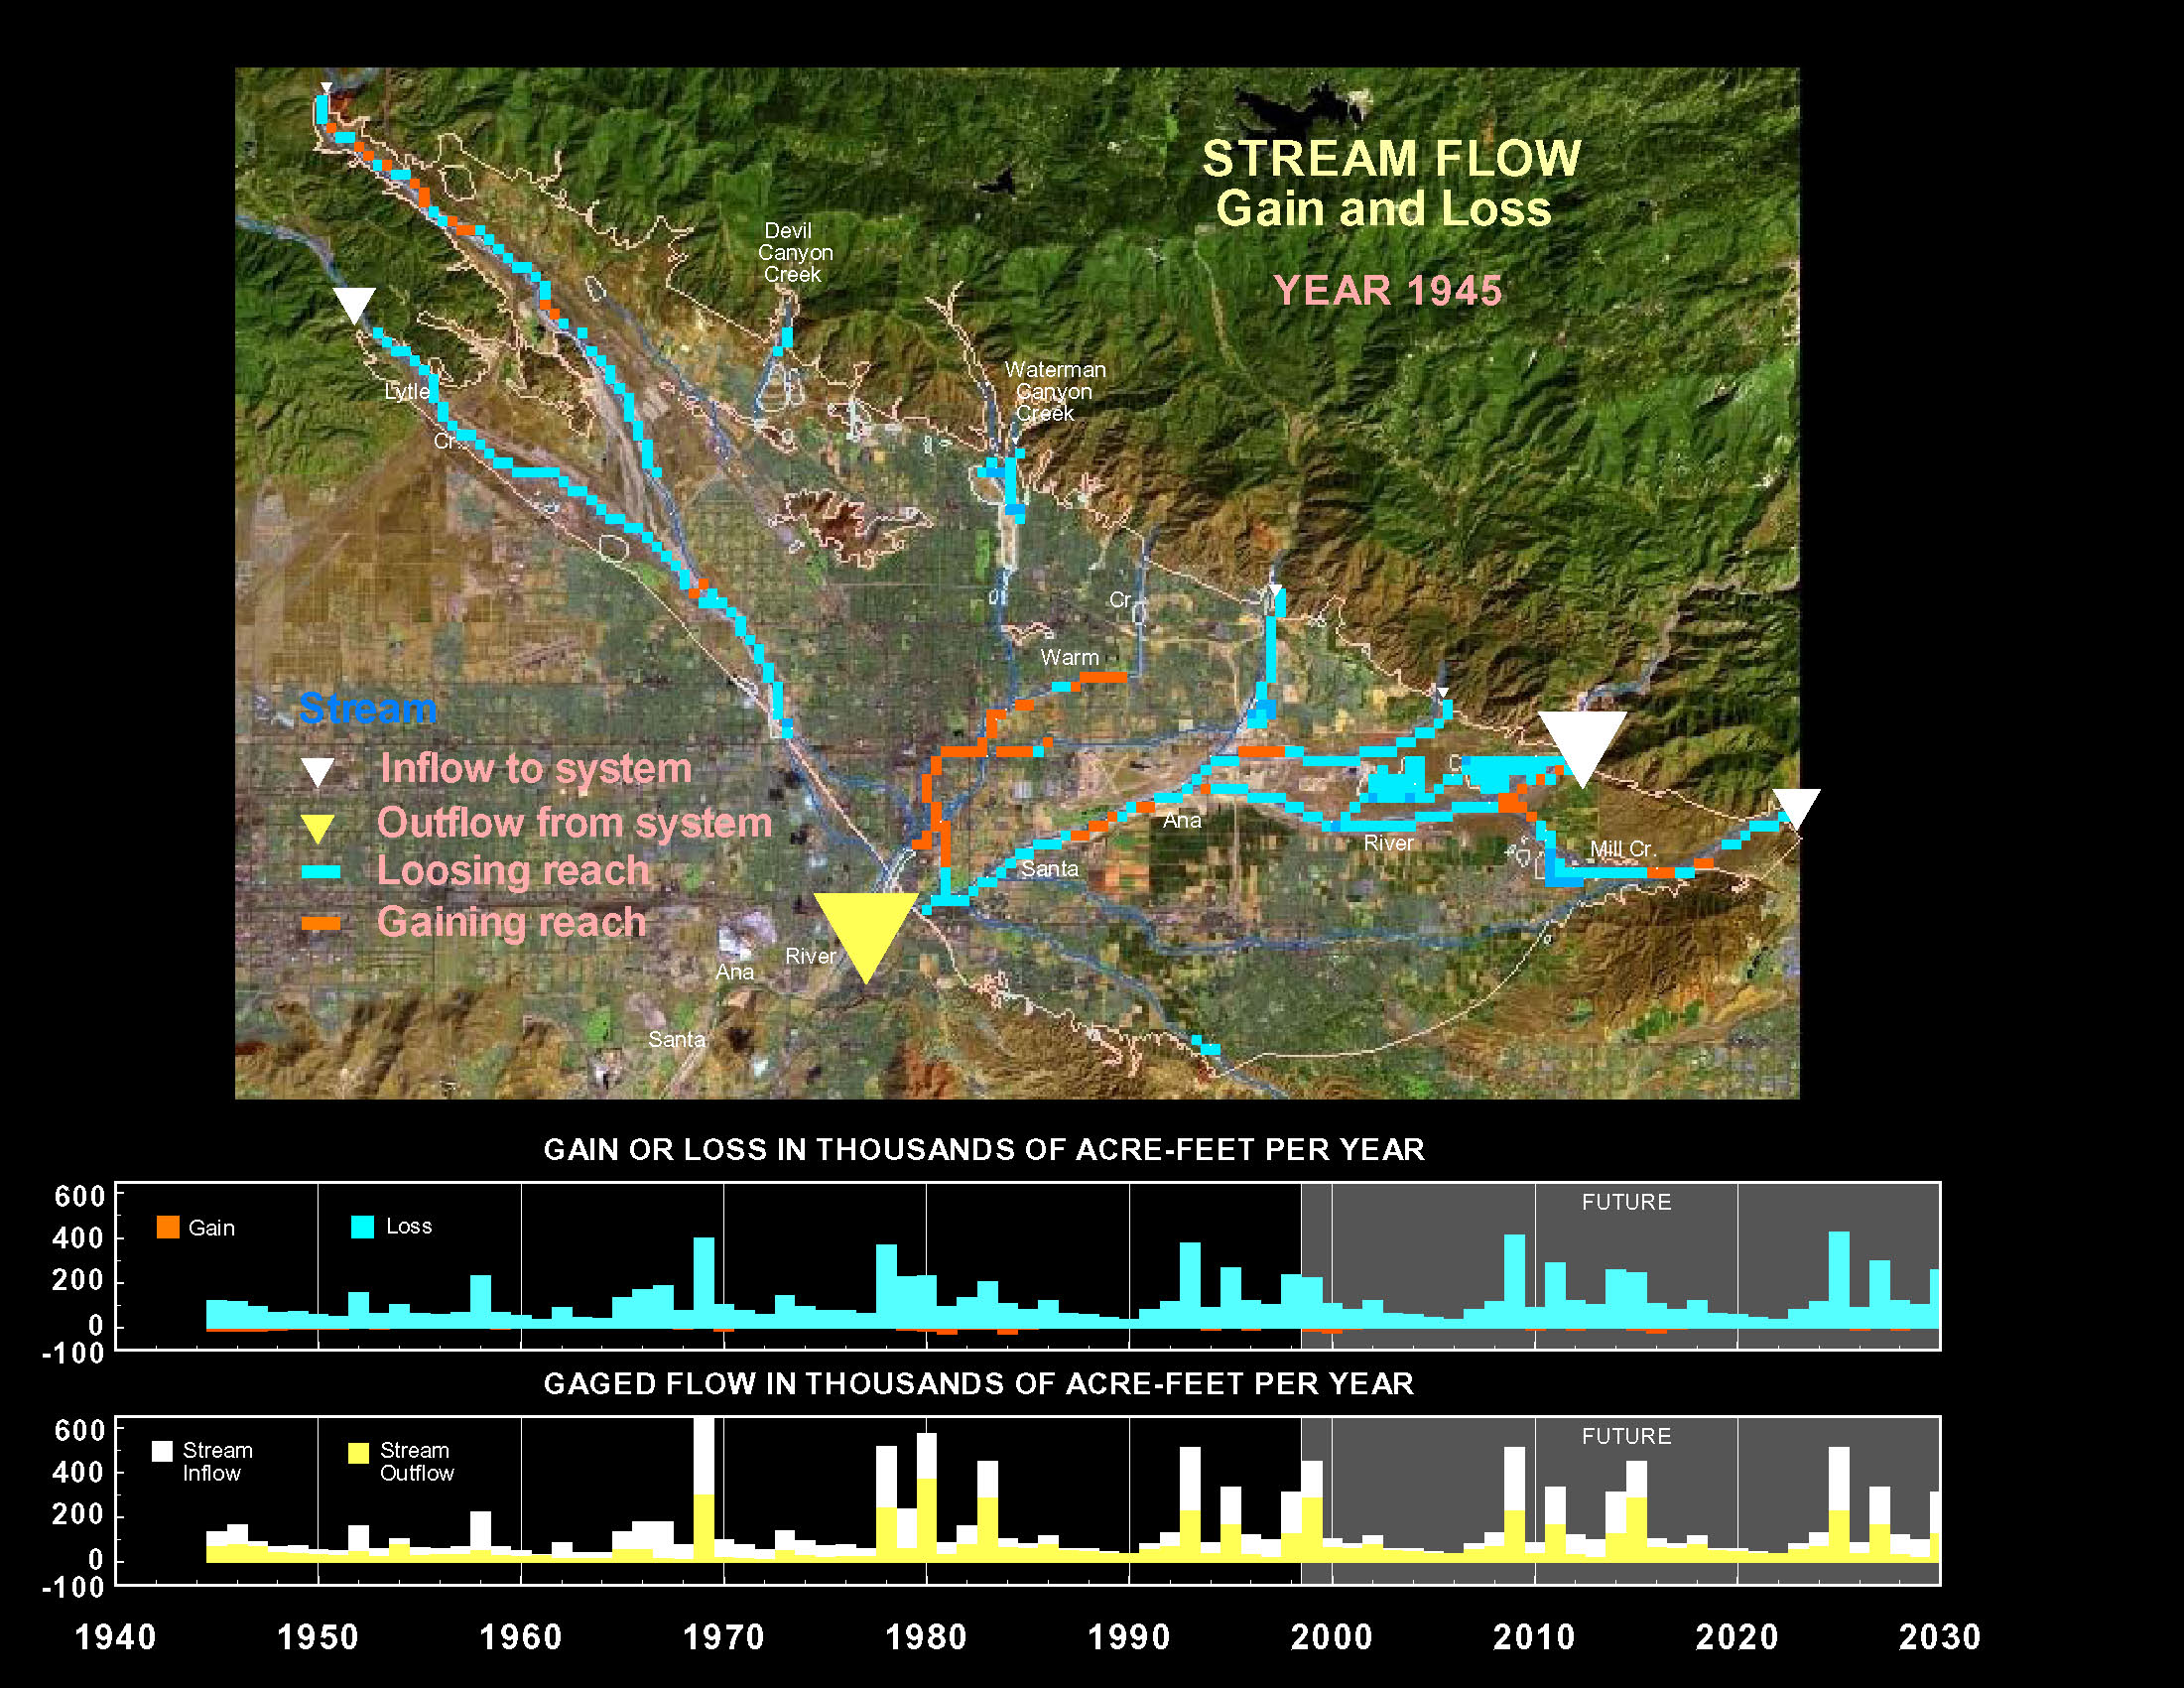
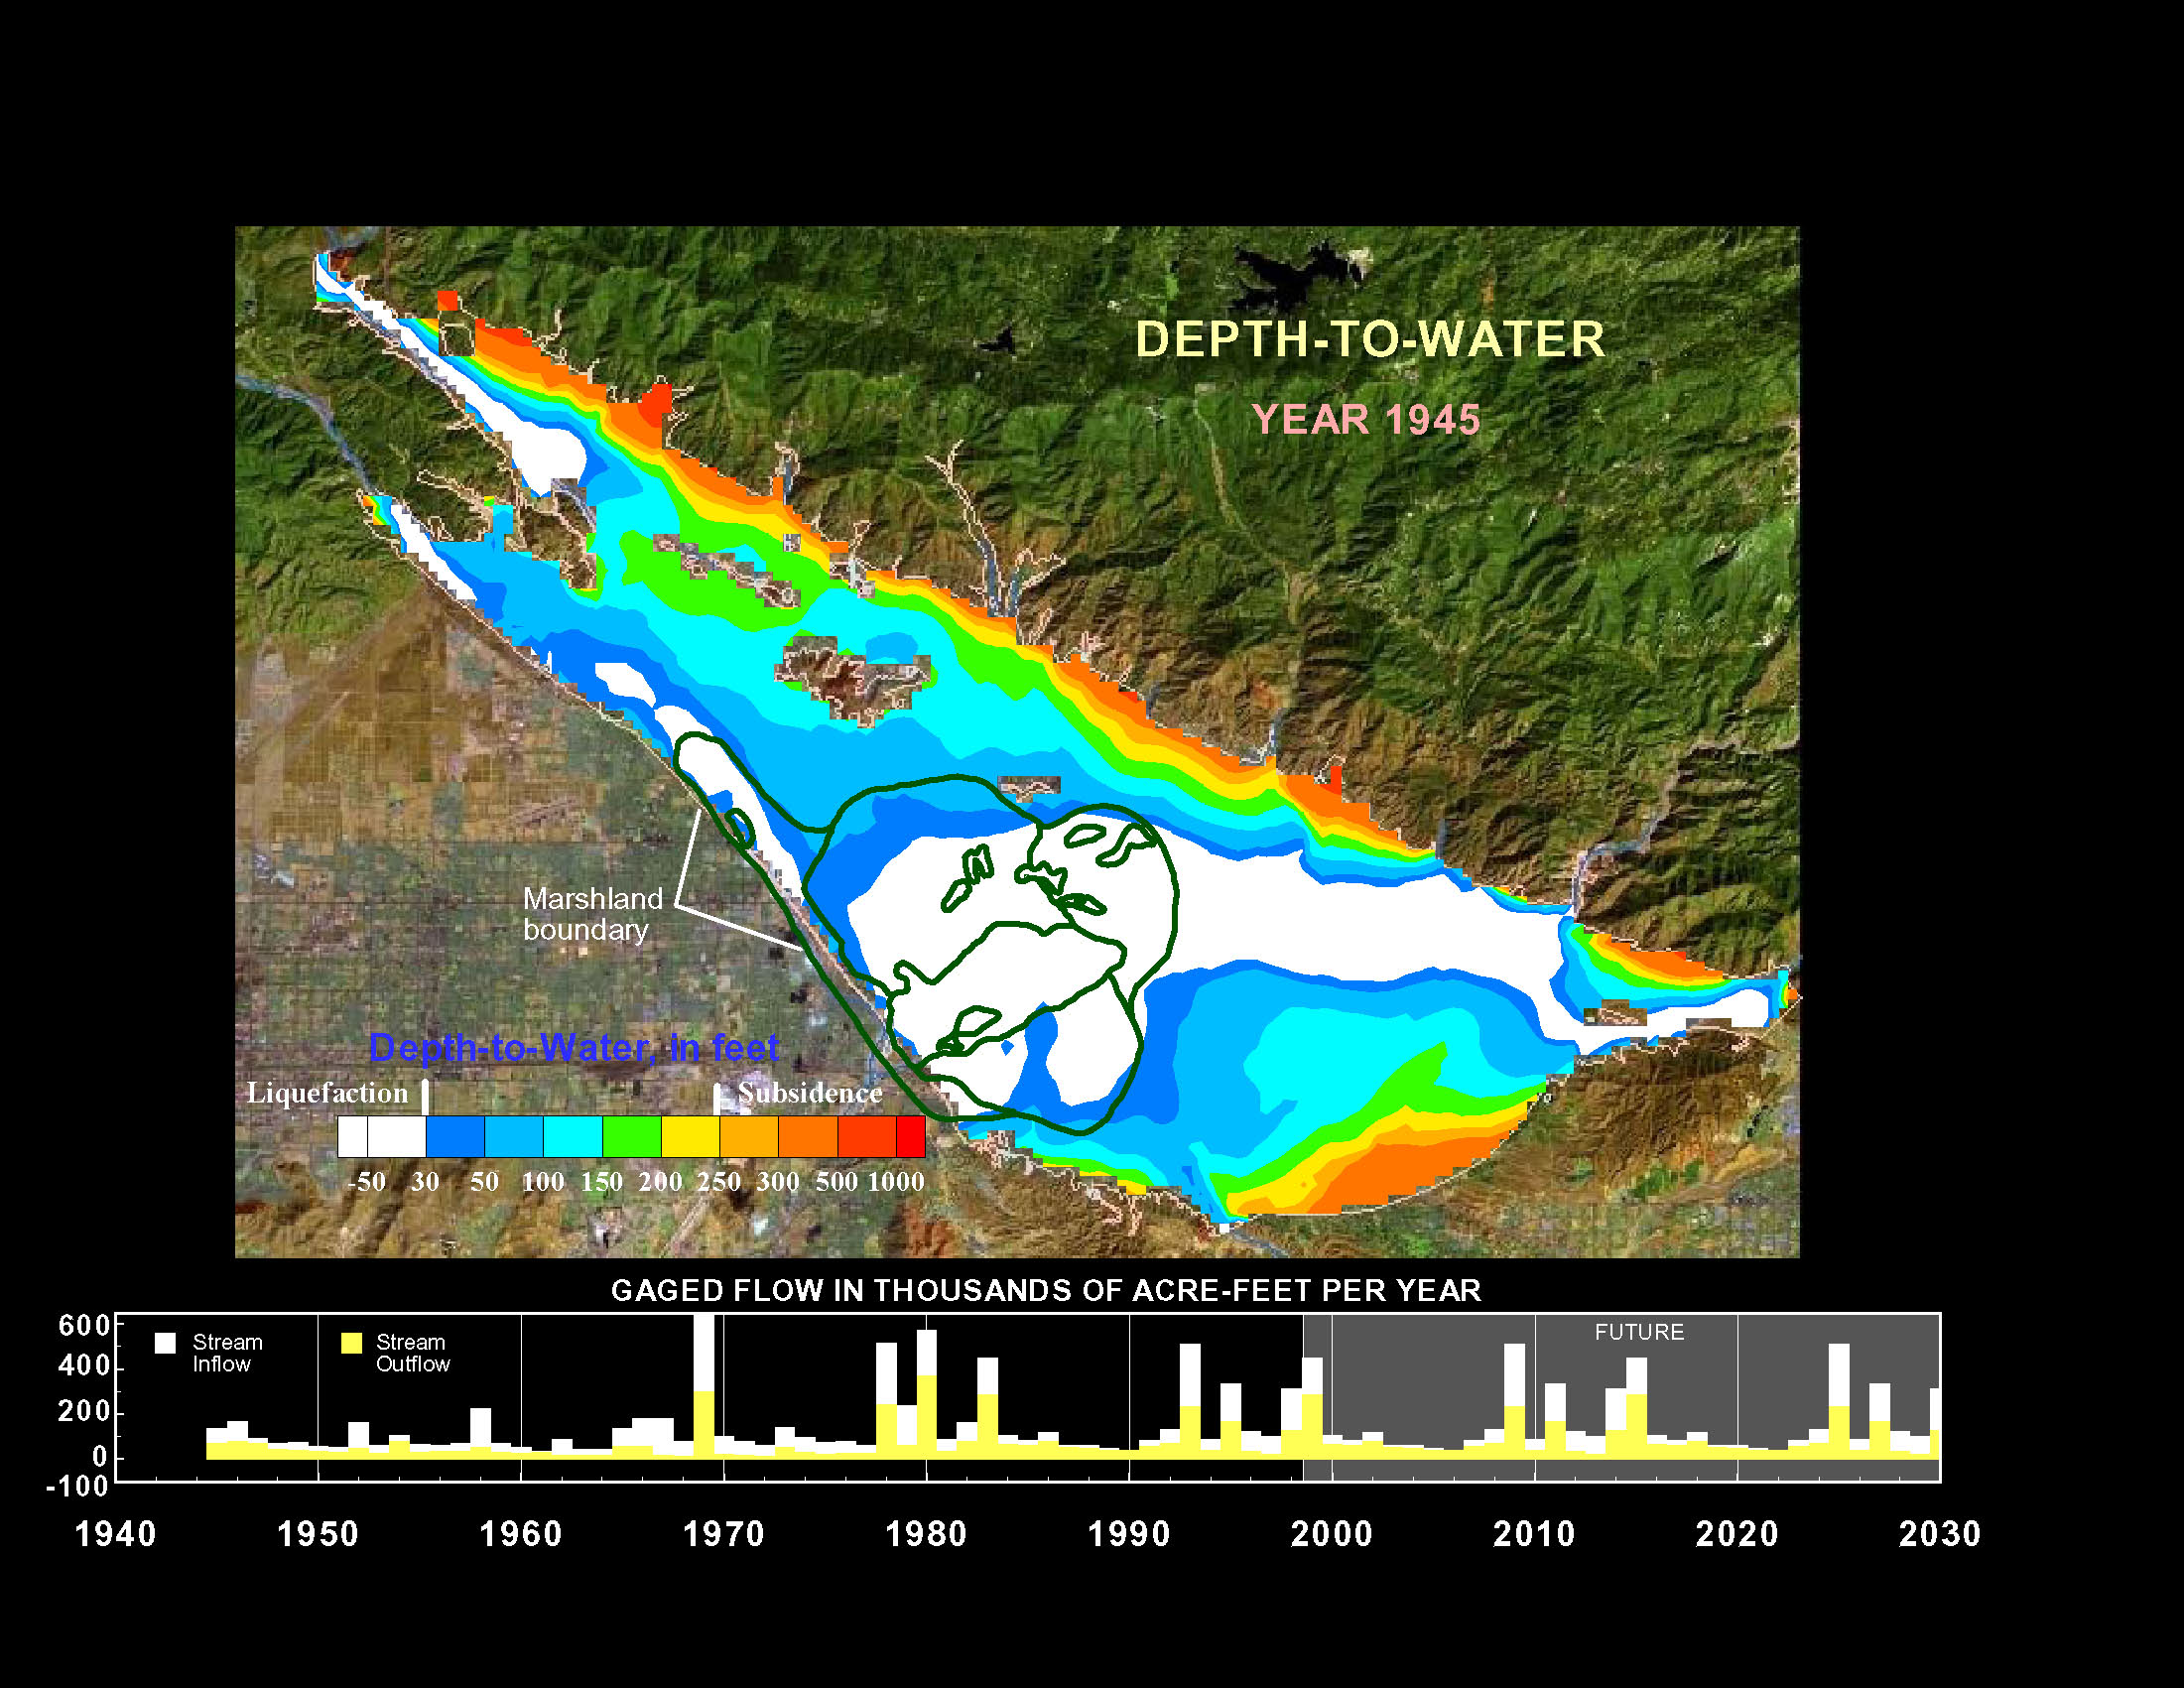
Continuing advances in simulation software, such as MODFLOW, have made it possible to represent many different physical processes. Unfortunately, this increase in both the number and complexity of simulated processes can create challenges for scientists constructing the model, decision makers using the results, and the lay public supporting the work. Three examples of visualization are developed to better understand key hydrodynamic interactions in the San Bernardino Valley ground-water basin. Of primary interest are the relations between pumpage and stream losses, and between stream recharge and potential liquefaction. The visualizations combine historical data and model results in animated maps and graphs for the simulation period 1945—2030. The resulting video clips contribute to improved understanding and insights about ground-water flow in the basin and are viewed frequently by project scientists, by water managers at board meetings, and by the lay public on a project website. The full text of this paper, including color figures and animations, is available at https://ca.water.usgs.gov/sanbern/vis/index.html.
Document Accessibility: Adobe Systems Incorporated has information about PDFs and the visually impaired. This information provides tools to help make PDF files accessible. These tools convert Adobe PDF documents into HTML or ASCII text, which then can be read by a number of common screen-reading programs that synthesize text as audible speech. In addition, an accessible version of Acrobat Reader 5.0 for Windows (English only), which contains support for screen readers, is available. These tools and the accessible reader may be obtained free from Adobe at Adobe Access.
Visualizations
Solution: Allow pop-ups. Open IE 7.x go Tools —> Manage Add-ons —> Enable or Disable add-ons; then disable the Shockwave ActiveX Control (not Shockwave Flasch Object). Refresh page.
Additional Visualizations
- Selected water-levels from 1936 to 1994
- Recharge from precipitation
- Pumpage
- Depth to water
- Simulated streamflow gains and losses with gaged stream inflow and outflow graph
- Stream infiltration and exfiltration with synchronized pumpage
- Evaportranspiration
- Simulated water-level change since 1944
- Storage
- Water-level response for recharge sites
San Bernardino Optimal Basin Management
Welcome to the U.S. Geological Survey (USGS) San Bernardino Optimal Basin Management website. This site provides hydrologic data collected or compiled by the USGS in the San Bernardino area; some additional data may be available from the USGS database National Water Information System (NWIS).
Project Chief: Wes Danskin
Phone: 619-225-6132
Email: wdanskin@usgs.gov
Questions about Optimal Basin Management? Please contact Wes Danskin (email: wdanskin@usgs.gov or send a letter). 619.225.6132