
Evaluation of the Hydrologic System and Selected Water-Management Alternatives in the Owens Valley, California
HYDROLOGIC SYSTEM
- Precipitation and Evapotranspiration
- Surface-Water System
- Ground-Water System
Download the contents of this page as a pdf file (1.3MB)
Download the contents of all Hydrologic System pages as a pdf file (3.3MB)
Download the entire report as a pdf file (8.3MB)
Surface-Water System
The primary source of surface water in the Owens Valley is precipitation that falls on the slopes of the Sierra Nevada. Rivulets from the resulting runoff form tributary streams that flow down mountain canyons, across the alluvial fans, and out onto the valley floor. In the Bishop Basin, the tributary streams are captured by the trunk stream of the valley, the Owens River, which has its headwaters in the Long Valley (figure 1). In the Owens Lake Basin, approximately 5 mi downstream (south) from the Tinemaha Reservoir, the Los Angeles Department of Water and Power diverts nearly all flow in the Owens River into the Los Angeles Aqueduct. The upstream end of the Los Angeles Aqueduct is referred to as the "intake" (figure 1). Any water not diverted into the aqueduct continues to flow east of the aqueduct in the natural channel of the lower Owens River. South of the intake, additional tributary streams along the west side of the valley are diverted into the aqueduct. The combined flows of the river-aqueduct system and the diverted tributary streams are routed south out of the valley through the Haiwee Reservoir. Any water remaining in the lower Owens River flows into the Owens Lake (dry) and evaporates. The entire Owens Valley drainage basin area is shown in figure 1, and photographs of major surface-water features in the Owens Valley are shown in figure 10. The river-aqueduct system, major tributaries, and selected gages within the area of concentrated study are shown in figure 11.
Surface-water monitoring in the Owens Valley is much more complete than in most basins in the United States. More than 600 continuous gaging stations are monitored by the Los Angeles Department of Water and Power in order to measure inflow to the valley from tributary streams and to document water use within the valley. Most of the continuous gages monitor minor flows in canals and ditches in the Bishop area to ensure that sufficient water is delivered to ranching operations. Many of the gages are on the tributary streams and are used to monitor inflow to the valley and to schedule diversions to the river-aqueduct system.
Monitoring of the river-aqueduct system and the lower Owens River is less well documented. Discharge in the river-aqueduct system is gaged routinely at only three locations (the Pleasant Valley Reservoir, the Tinemaha Reservoir, and near the Alabama Hills); discharge in the lower Owens River is gaged routinely at only two locations (immediately below the intake to the aqueduct and at Keeler Bridge) (figure 11). For other locations, "calculated" discharge values are made by using measured and estimated inflow, outflow, and water use. These calculated values are subject to a large roundoff error as a result of the addition and subtraction of many numbers.
Tributary Streams
Tributary streams provide nearly 50 percent of the surface-water inflow to the Owens Valley; the Owens River and ungaged runoff provide the rest (M.L. Blevins, Los Angeles Department of Water and Power, written commun., 1988; Hollett and others, 1991, tables 2 and 3). Many of the natural channels of tributary streams have been modified by the Los Angeles Department of Water and Power for operation of the river-aqueduct system. Diversion structures have been installed in nearly all streams, and the natural channels of some streams, such as Goodale Creek, have been straightened. Other streams, namely Bishop Creek, Thibaut Creek, Division Creek, and Coldwater Canyon Creek, are diverted to pipes for much of their length (figure 11). In the Bishop Basin, most of the tributary streamflow that reaches the valley floor is diverted to canals that distribute water for agricultural uses, wildlife habitat, or ground-water recharge. Excess water is returned to the canals and eventually to the Owens River.
Since 1913, little or no tributary streamflow in the Owens Lake Basin has reached the lower Owens River in average-runoff years. During wet years when surface water is abundant, however, tributary streamflow exceeds the capacity of the river-aqueduct system, and some of the tributary streamflow either is diverted onto the alluvial fans to recharge the ground-water system or is conducted in pipes over the top of the aqueduct and then flows across the valley floor toward the lower Owens River.
Tributary streamflow in the Owens Valley is gaged continuously by the Los Angeles Department of Water and Power at more than 60 sites on 34 tributaries. The sites, many constructed originally during prior investigations by the U.S. Geological Survey in the early 1900's (W.T. Lee, 1906; C.H. Lee, 1912), are equipped with concrete channel controls, stilling wells, and automatic data recorders. On most of the tributaries, at least two sites are gaged. Typically, one gage is located near the base of the mountains, and the other is located close to the river-aqueduct system. The location of these gages is shown in figure 11. The station names and abbreviations are given in table 6. A complete record at the sites, except for occasional short gaps, is available for water years 1935—88 (M.L. Blevins, Los Angeles Department of Water and Power, written commun., 1988).
Mean annual discharge for tributaries measured at base-of-mountains gaging stations ranged from 51 to 67,748 acre-ft (Hollett and others, 1991, table 2). Tributaries having the greatest flow include Bishop, Big Pine, Cottonwood, Independence, and Lone Pine Creeks (figure 11). Mean annual discharge for most streams was about 6,000 acre-ft. Annual flow is highly variable, and maximum and minimum mean annual discharge values for individual streams typically differ by a factor of 10 or more. Although useful as a guide, annual values (Hollett and others, 1991, table 2) tend to mask periods of even higher or lower flows occurring within a single year. Variability in streamflow among tributaries results from differences in size of the drainage basin, quantities of precipitation per basin, and rates of infiltration. In general, tributary streamflow increases from south to north much as precipitation does (figure 7).
As expected from precipitation patterns (figure 7A), discharge from tributary streams on the east side of the valley is much less than discharge on the west. Only two streams produce a reliable source of water each year—Coldwater Canyon and Silver Canyon Creeks (figure 11), and these streams typically discharge less than 2,000 acre-ft/yr. Farther south, Mazourka Creek was monitored by the U.S. Geological Survey continuously during 1961—72 (Mazourka Creek near Independence, USGS station 10282480). Zero flow was recorded all days except during two brief periods in 1967 and 1969. During these periods, discharge peaked at more than 1,300 and 600 ft3/s, respectively. This type of large, infrequent runoff is characteristic of other basin-and-range valleys (Fenneman, 1931, p. 329) and probably is typical of most stream drainages along the east side of the Owens Valley south of Silver Canyon Creek (figure 11).
Percent Valleywide Runoff
Total runoff for the Owens Valley is highly correlated with flow in individual tributary streams and has been calculated by the Los Angeles Department of Water and Power (M.L. Blevins, written commun., 1988; table 5) for water years 1935—88. Total runoff is defined as the sum of inflow from the Owens River at the Pleasant Valley Reservoir, measured and estimated inflow from tributary streams, and estimated mountainfront runoff between tributary streams. From annual values of total valleywide runoff, the percent of longterm average annual valleywide runoff for a specific year, referred to locally as the "percent runoff year," is calculated and used extensively by the Los Angeles Department of Water and Power to guide water management decisions. Values for water years 1935—88 are given in table 7.
Using the percent runoff year for various analyses has two major advantages over other methods: (1) it provides a simple, unifying theme to many complex calculations, and (2) it is relatively independent of the specific method and values used by different individuals and agencies to calculate valleywide runoff. As a result, this key parameter was used extensively in this study, particularly in the analysis of recharge from tributary streams and in the evaluation of selected water-management alternatives.
The probability distribution of the percent runoff year for the Owens Valley for water years 1935—84 is shown in figure 12. This graph and the related best-fit line identify the likely occurrence of a particular percent runoff year. For example, a runoff year having 70 percent or less of the average annual runoff (a 70-percent runoff year) will occur about 15 percent of the time, or about 1 out of 7 years. Water years 1976 and 1977 fall into this category.
The method of developing the probability plot uses the technique of Weibull (1939), as described by Chow (1964, p. 8—28). The 50 annual values for water years 1935—84 (table 7) were assumed to be independent and follow a lognormal distribution. The values were ranked in order (r) and plotted on lognormal probability paper using the relation r/(n + 1), where in this case n equals 50. A general trend line was fitted by hand. Although skewness in the data was recognized (mean equals 100, median equals 94), no other evaluation of the probability distribution was made.
Runoff during the detailed period of analysis chosen for this study, water years 1963—88, slightly exceeded (106 percent) the long-term average runoff. Thus, despite two periods of exceptionally dry conditions (1976—77 and 1987—88) (table 7), the overall period was wetter than normal. In addition, unusually high runoff years—1967, 1969, 1978, 1980, 1982, and 1983—all occurred during this period (figure 12).
Tributary Stream Recharge
Tributary streams generally lose water as a result of streambed leakage, diversions of streamflow onto the alluvial fans, and, to a lesser extent, evapotranspiration from areas along the stream channel. Several streams also receive water from pumped wells just upstream from the river—aqueduct site (figure 11), and a few streams receive water from springs, canals, or diversions from other streams. Some streams may gain water in lower reaches because of local seepage of ground water caused by faults, shallow bedrock, or changes in the hydraulic characteristics of the depositional material. Although discharge at the base-of-mountains and river—aqueduct sites is gaged continuously and pumpage from wells is metered, other gains to or losses from tributary streams generally are not measured or are not measured continuously.
The basic technique used to estimate tributary stream recharge is similar to that of C.H. Lee (1912) and uses the following general equation:
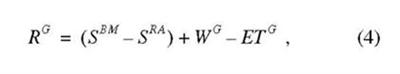
where
- RG is stream recharge to the aquifer system for the reach between the base-of-mountains and river—aqueduct gages, in acre-feet per year;
- SBM is measured stream discharge at the base-of-mountains gage, in acre-feet per year;
- SRA is measured stream discharge at the river—aqueduct gage, in acre-feet per year;
- WG is measured well discharge that flows into the stream between the base-of-mountains and river—aqueduct gages, in acre-feet per year; and
- ETG is the estimated evapotranspiration between the two gages in the immediate vicinity of the stream channel, in acre-feet per year.
Streamflow data for a 50-year period, water years 1935—84, were used to determine the loss for each tributary stream, defined as the sum of RG and ETG. Because all other values in equation 4 are measured, the quantity of stream loss between the base-of-mountains and river—aqueduct gages is well documented. As shown in figure 13, stream loss for each stream is fairly predictable if the quantity of discharge at the base-of-mountains gage (SBM) is known. From the regression equation for each stream (figure 13), the quantity of stream loss between the gages can be calculated for any known or estimated discharge at the base-of-mountains gage. Similar graphical relations were evaluated, and linear regression equations were developed, for each of the 34 tributary streams using data from the discharge gages identified in figure 11 and listed in table 6.
The average stream loss rates (coefficient a in the regression equations in figure 13 with the general form y = ax) calculated from the 50 years of discharge data generally are higher than those reported by C.H. Lee (1912, p. 9), who used about 4 years of record. The cause of the increase is not known, but it may result from the slightly greater length of the gaged section, additional diversions of water from the streams, or changes to the channels.
Tributary stream recharge between the gages (RG) was calculated from stream loss by estimating evapotranspiration for each stream using the equation,
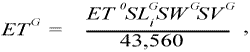
where
- ETG is estimated evapotranspiration between the two gages in the immediate vicinity of the stream channel, in acre-feet per year;
- ETO is the average annual evapotranspiration rate for high-water-use species, in feet per year;
- SLG is the length of the stream channel between the two gages, in feet;
- SWG is the width of vegetation near the stream channel, in feet; and
- SVG is the percent of vegetative cover near the stream, expressed as a decimal fraction.
Because detailed data were not available for most variables in equation 5, estimates were made on the basis of limited field observations of Bishop, Independence, Oak, Taboose, and Lone Pine Creeks, and measurements of vegetative conditions on the valley floor (table 5) (D.P. Groeneveld, Inyo County Water Department, written commun., 1986; Duell, 1990). Constant values were chosen for SWG (50 ft), ETO (47 in/yr), and SVG (0.30). Stream length was measured by digitizing 1:24,000-scale topographic maps. For each of the tributary streams, evapotranspiration was found to be minimal, ranging from about 10 to less than 100 acre-ft/yr (Hollett and others, 1991, table 8). This quantity generally is less than about 2 percent of the discharge at the base-of-mountains gage and less than about 5 percent of the estimated recharge between the two gages.
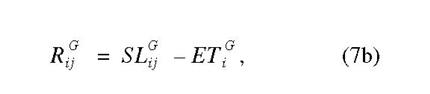
For selected water years, such as the groundwater simulation period (water years 1963—88), annual discharge at each base-of-mountains gage was estimated by multiplying the 50-year average discharge at the base-of-mountains gage (water years 1935—84) by the percent runoff year for individual years (table 7). Recharge above or below the gaged section of the stream was determined from gaged records of diversions and by comparing respective lengths of stream channels in the gaged and ungaged sections. The relation for total recharge for a stream (i) in water year (j) can be expressed as:
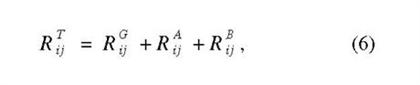
where
- RT is the total stream recharge between the surrounding bedrock and the river-aqueduct system, in acre-feet per year;
- RG is stream recharge that occurs between the base-of-mountains and river—aqueduct gages, in acre-feet per year;
- RA is the stream recharge that occurs above the base-of-mountains gage, in acre-feet per year; and
- RB is the stream recharge that occurs below the river—aqueduct gage, in acre-feet per year.
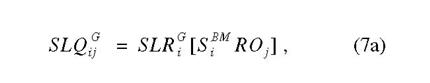
and stream recharge estimated as,
where
- SLQG is the quantity of water lost from the stream between the base-of-mountains and river—aqueduct gages, in acre-feet per year;
- SLRG is the average loss rate (a), determined from the regression equation y = ax (figure 13) expressed as a decimal fraction;
- SRM is the long-term mean annual discharge at the base-of-mountains gage (Hollett and others, 1991, table 2), in acre-feet per year;
- RO is the percent runoff year (table 7), expressed as a decimal fraction; and
- ETG is estimated evapotranspiration between the two gages in the immediate vicinity of the stream channel, in acre-feet per year.
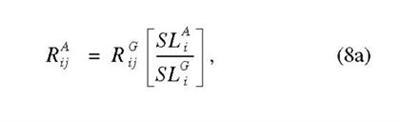
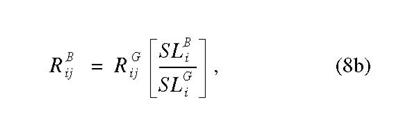
and
where
- SLA is stream length above the base-of-mountains gage, in feet;
- SLG is the stream length between the base-of-mountains and river—aqueduct gages, in feet; and
- SLB is stream length below the river—aqueduct gage, in feet.
Several of the tributary streams could not be evaluated using this approach because only a single gaging station was operated on the stream, because unquantified diversions were made from one stream to another, or because a spring between the two gages added an unknown quantity of water to the stream. In these cases, an average recharge rate per foot of stream channel was calculated for streams with two gages (Hollett and others, 1991, table 8). These recharge rates were applied to streams that have similar annual discharge rates and that flow over similar types of materials.
For a few streams, the long length of channel above the base-of-mountains gage (SLA), such as for Independence Creek (figure 11), produced an unrealistically high quantity of recharge, indicating that the stream may have been flowing on top of a narrow, fully saturated, alluvial fan or glacial deposit that was not capable of receiving additional water from the stream. For these sections of streams, recharge estimates were scaled downward on the basis of a shorter recharge length for the stream and on recharge values for similar nearby streams. Diversion of flow from Big Pine Creek and Oak Creek for domestic use and irrigation on nearby Indian reservations decreased recharge rates for those streams in comparison with the total loss rate calculated from equation 4. Using these methods, the average annual recharge for all tributary streams within the area of the defined aquifer system (figure 2) was estimated to be 106,000 acre-ft/yr for water years 1963—69 and 103,000 acre-ft/yr for water years 1970—84.
Ungaged Runoff
Mountain-Front Runoff Between Tributary Streams
Most runoff from precipitation falling on the mountains surrounding the Owens Valley is measured at the base-of-mountains gaging stations on the major tributary streams (figure 11). Some runoff, however, occurs from precipitation falling on ungaged drainage areas between gaged tributary streams. Precipitation in these small, triangular-shaped areas—commonly referred to as intermountain slopes (C.H. Lee, 1912)—runs off as sheet flow, in rivulets, or in small intermittently flowing streams. The intermountain slopes along the southwest side of the basin were mapped and described by C.H. Lee (1912, p. 13 and pl. 1). Most of the runoff from these areas disappears into the alluvial fans a short distance from the edge of the mountains. This water, referred to as "hidden recharge" by Feth (1964a) because it is not measured, either is transpired by nearby plants or contributes recharge to the ground-water system. The increase in vegetation along the upper part of the alluvial fans observed by M.O. Smith and others (1990a, b) may result not only from increased precipitation, related to the increase in altitude (figure 7B), but also from runoff between tributary streams.
The abundance of springs in many bedrock areas along both sides of the valley (shown on USGS 1:62,500-scale topographic maps) indicates that the quantity of water contributed to the basin might be significant. For example, discharge from Scotty Springs near Division Creek (Mt. Pinchot quadrangle) has been measured at greater than 2 ft3/s (C.H. Lee, 1912, p. 44). Except for spring discharge, the total quantity of ungaged surface-water inflow is difficult or impossible to measure.
Instead, estimates of the quantity of ungaged surface-water inflow and resulting ground-water recharge typically are made using precipitation records, runoff coefficients calculated for gaged drainage areas, and assumptions about the percentage of runoff that percolates to the ground-water system. Using this approach in the southwestern part of the Owens Valley, C.H. Lee (1912, p. 66—67 and table 61) estimated that as much as 75 percent of the total volume of precipitation on the ungaged drainage areas recharged the ground-water system. Lee noted that the high rate resulted from steep mountain slopes and rapid melting of snow, both of which minimize losses from evapotranspiration and percolation through the extremely transmissive alluvial fan deposits.
In the present study, recharge for each of the ungaged drainage areas was estimated in a similar manner, but using different percolation rates depending on the part of the valley being analyzed. Recharge for each area along the southwest side of the valley was calculated using the average annual precipitation from figure 7 and the 75-percent percolation rate suggested by C.H. Lee (1912). Recharge for areas along the northwest side of the valley was somewhat less because of smaller drainage areas, lower precipitation values, or an abundance of mountain meadows that discharge the ungaged water as evapotranspiration before it can reach the valley ground-water system. Recharge for the Volcanic Tableland was significantly less than for areas on the west side of the valley because precipitation rates are much lower (figure 7), potential evaporation is much higher because of the higher average temperature, and percolation is restricted by the impermeable capping member of the Bishop Tuff (figures 4 and 5). Recharge for areas on the east side of the basin was almost zero because virtually no runoff has been observed between the intermittently flowing tributary streams, particularly those south of Coldwater Canyon Creek (figures 3 and 11).
A few of the larger ungaged streams flow far enough down the alluvial fans to join a major tributary stream below the base-of-mountains gage (figure 3). This addition of water to the gaged tributaries is not accounted for in the estimates of tributary streamflow or tributary stream recharge described earlier in the section "Tributary Streams." This recharge, however, is accounted for using the method described above for ungaged runoff.
Recharge to the defined aquifer system (figure 2) contributed from all ungaged areas was estimated to average approximately 26,000 acre-ft/yr for both water years 1963—69 and water years 1970—84. In order to estimate ungaged recharge for different water years, the long-term average recharge rates were multiplied by the annual percent of valleywide runoff (table 7). Although a high degree of uncertainty is associated with the values of recharge between tributary streams, recharge from ungaged areas for most of the valley is a relatively small component of the ground-water budget. Significant refinement in the quantity of runoff or ground-water recharge is unlikely because of the difficulty of measurement. However, a comprehensive surface-water/ground-water budget for the entire valley, as suggested by Danskin (1988), might improve the confidence limits for ungaged runoff and the related ground-water recharge.
Runoff from Bedrock Outcrops Within the Valley Fill
A small quantity of precipitation falls on the bedrock outcrops within the valley fill, in particular on the Tungsten Hills, the Poverty Hills, and the Alabama Hills (figure 7). Most of the precipitation probably is evaporated or transpired by the sparse native vegetation covering the hills. Some runoff can occur during longer duration, high-intensity storms. This quantity is not important either for local uses or for export from the valley.
Springs visible on the north and west sides of the Alabama Hills (Lone Pine and Union Wash quadrangles, USGS 1:24,000-scale topographic maps) indicate that precipitation does exceed evapotranspiration and that some local infiltration occurs into the soil and fractured rocks. During longer duration storms, some recharge to the ground-water system in the immediate vicinity of the bedrock outcrops probably occurs. Also, some additional recharge probably occurs from the minor spring discharges along the sides of the bedrock outcrops. A likely range of recharge values was determined using estimates of average precipitation (figure 7) and a range of possible runoff coefficients (C.H. Lee, 1912). The total quantity of recharge to the aquifer system (figure 2) from runoff from bedrock outcrops for average conditions of precipitation and evaporation probably is less than 1,000 acre-ft/yr.
Owens River and the Los Angeles Aqueduct
The river-aqueduct system within the study area extends from the Mono Basin to the Haiwee Reservoir (figure 1). At the northernmost point of the river-aqueduct system in the Mono Basin, streams flowing out of the Sierra Nevada are diverted into a concretebox conduit. The diverted water is routed to Grant Lake in the Mono Basin and eventually is conveyed to the Owens River in the Long Valley through the 11.3-mile-long Mono Craters Tunnel (figure 1). The mean annual discharge through the tunnel is about 72,000 acre-ft. At the end of the Mono Craters Tunnel, water from the Mono Basin joins the upper reach of the Owens River and together flows about 12 mi to Lake Crowley, also known as the Long Valley Reservoir. Lake Crowley, which is the largest reservoir in the river-aqueduct system, regulates the flow of water through a 96- to 108-inch pipeline (penstock) that connects Lake Crowley in the Long Valley with the Pleasant Valley Reservoir in the Owens Valley. The natural channel of the Owens River through the Volcanic Tableland is used infrequently to convey floodwaters or to divert water during maintenance of the pipeline. Three hydroelectric plants located along the pipeline generate electricity as a result of a drop in altitude of about 1,600 ft from the Long Valley to the Owens Valley. The mean annual discharge of the Owens River at the Pleasant Valley Reservoir increased from about 250,000 acre-ft for water years 1935—69 to about 330,000 acre-ft for water years 1970—84 (table 8). This increase resulted from additional diversion of water from the Mono Basin, as well as from greater runoff during the latter, wetter period (106 percent runoff in comparison with 97 percent).
The Pleasant Valley Reservoir regulates flow to the natural channel of the Owens River downstream from the outlet tower at the Pleasant Valley Dam. Between the Pleasant Valley Reservoir and the Haiwee Reservoir at the south end of the Owens Valley, discharge in the river-aqueduct system is constantly altered by gains of water from streams, springs, pumped wells, flowing wells, and seepage from the ground-water system, as well as by losses of water to irrigation and to the ground-water system. Emerging from the Pleasant Valley Reservoir, the Owens River continues south, gaining water primarily from tributary streams and from pumped and flowing wells before discharging into the Tinemaha Reservoir at the south end of the Bishop Basin. A photograph (figure 10A) taken just north of Bishop near the Five Bridges area (Fish Slough quadrangle, USGS 1:24,000-scale topographic map) shows the general character of the Owens River in the Bishop Basin. The natural, meandering channel of the Owens River is generally about 20 to 50 ft wide and about 3 to 6 ft deep, and has a silt, sand, and clay bottom. The mean annual discharge of the Owens River at the Tinemaha Reservoir was about 390,000 acre-ft for water years 1970—84, or about 60,000 acre-ft/yr greater than the discharge at the north end of the Bishop Basin at the Pleasant Valley Reservoir (table 8).
Flow in the Owens River resumes south of the Tinemaha Reservoir and continues for approximately 5 mi until virtually all water is diverted into the unlined, trapezoidal channel of the Los Angeles Aqueduct (figure 10b). Flowing along the toes of the western alluvial fans, the aqueduct gains additional water from streams and wells. In the Owens Lake Basin, tributary streams are generally smaller, although more numerous than in the Bishop Basin, and there are fewer diversions for agricultural uses. At the Alabama Gates (figure 11), on the north side of the Alabama Hills, the aqueduct changes to a concrete-lined channel. The mean annual discharge at the Alabama Gates was about 450,000 acre-ft for water years 1970—84, or about 60,000 acre-ft/yr greater than the discharge at the Tinemaha Reservoir (table 8). At the Haiwee Reservoir at the southern boundary of the study area, mean annual discharge is about 1.5 times mean annual discharge at the Pleasant Valley Reservoir (table 8). The Haiwee Reservoir regulates and temporarily stores water before releasing it into the two channels of the dual-aqueduct system that conveys the water to the Los Angeles area. After completion of the second aqueduct, discharge to Los Angeles increased approximately 160,000 acre-ft/yr both as a result of changes in management practices and greater average runoff (tables 4, 7, and 8).
Since the early 1900's, successive changes in water management have altered the role of the Owens River in the Owens Valley hydrologic system. Prior to development of the river-aqueduct system, the natural channel of the Owens River was the primary drain of both the surface-water and ground-water systems. Tributary streams flowed across the valley floor to merge with the river, and ground water flowed upward under pressure to augment discharge in the perennially flowing Owens River. After operation of the Los Angeles Aqueduct was begun in 1913, the hydrologic system of the valley remained dominated by the Owens River in the Bishop Basin, but the system became dominated by the Los Angeles Aqueduct in the Owens Lake Basin. The diversion of tributary streams at the edge of alluvial fans into the aqueduct prevented the lower Owens River from acting as a major surfacewater collector. The river-aqueduct system drained the surface-water system, and the Owens River in the Bishop Basin and the lower Owens River in the Owens Lake Basin drained the ground-water system.
After 1970, increased ground-water pumping began to change these conditions. What had been a relatively simple hydrologic system began the transition to a more complex system with dynamically changing surface-water/ground-water interactions. In at least one area of the valley near Big Pine, the Owens River began losing water to the ground-water system. Water-level data collected from nearby wells show a hydraulic gradient from the Owens River to production wells along the edge of Crater Mountain (figure 11). In other parts of the valley with high ground-water pumpage, such as near Laws, the quantity of water gained by the Owens River from the ground-water system probably was reduced.
The Los Angeles Aqueduct, because it is elevated topographically above the center line of the valley, never acted as a major ground-water collector. However, for most of its unlined length, the aqueduct is at an altitude at which it can exchange water readily with the ground-water system. The local hydraulic gradient between the aqueduct and the ground-water system, as described above for the Owens River, determines the direction and rate of flow. Hydrogeologic sections developed by Hollett and others (1991, pl. 2), Griepentrog and Groeneveld (1981), and the Los Angeles Department of Water and Power (1978) indicate the general areas where the aqueduct gains or loses water for different ground-water conditions. Under average conditions, most sections of the aqueduct continue to gain water from the ground-water system. However, during periods of significant groundwater withdrawals, such as 1971—74, ground-water levels near the aqueduct decline and the rate of gain decreases; the decline can be sufficient to change the direction of flow, resulting in a loss of water from the aqueduct. This condition likely occurred in areas with numerous production wells, such as between Taboose and Thibaut Creeks (figure 11). South of George Creek, the altitude of the aqueduct is generally above even the highest ground-water levels; therefore, the aqueduct loses water to the ground-water system. The concretelined section of the aqueduct adjacent to the Alabama Hills also is elevated above the nearby ground-water system and has the potential to lose water; however, the loss through the concrete and related joints probably is minimal.
Estimates of the quantity of loss (or gain) for the river-aqueduct system typically are calculated as the residual of a mass balance for a gaged section of the stream. This is the same method used to calculate recharge for the tributary streams. When the loss is a small fraction of the measured flows, however, large residual errors can result, masking the actual loss or gain. For this reason, estimates of the likely range of loss or gain for the river and aqueduct were developed using loss studies on canals that flow over similar materials, but have a much smaller discharge.
Analysis of several canals in the Laws area indicates that a 15-foot-wide canal with a mean discharge of 2 to 10 ft3/s typically loses 0.3 to 1.1 (ft3/s)/mi (R.H. Rawson, Los Angeles Department of Water and Power, oral commun., 1988). Similar loss rates were calculated for tributary streams (Hollett and others, 1991, table 8). If vertical conductivity for the canals, river, and aqueduct are similar, then these rates equate to approximately 1 to 3 (ft3/s)/mi for the wider Owens River or the Los Angeles Aqueduct. Because the rate of exchange (either loss or gain) between the river or aqueduct and the ground-water system is dependent on the physical characteristics of the stream channel, which are fairly constant, and on the local hydraulic gradient between the stream and the groundwater system, which generally varies over a small range of values, the exchange rates probably are similar for both the gaining and losing reaches of the river and aqueduct.
If bed material of the river-aqueduct system is finer grained than bed material of the tributary streams and selected canals, the exchange rates probably are less for the river—aqueduct than for streams or canals. To accommodate this uncertainty, ground-water recharge or discharge (river—aqueduct loss or gain) was determined by applying a range of estimated rates of gain or loss to the respective gaining or losing sections of the river-aqueduct system and then comparing these values with results from the valleywide ground-water flow model. For the area of the aquifer system (figure 4), the river-aqueduct system during water years 1963—69 and water years 1970—84 was estimated to gain approximately 16,000 acre-ft/yr and 3,000 acre-ft/yr, respectively.
As part of an extensive surface-water monitoring network, the Los Angeles Department of Water and Power computes mass balances for various sections of the river-aqueduct system. These calculations are given stations identifiers, such as those in table 6, and are listed in a monthly report, "Uses and Losses" (L. Lund, Los Angeles Department of Water and Power, written commun., 1988). The mass-balance values for several years suggest that the Owens River gains about 33,000 acre-ft/yr from the ground-water system between the Pleasant Valley Reservoir and the Tinemaha Reservoir (station PXHU, table 6). This value is equivalent to a rate of gain of about 1.5 (ft3/s)/mi of river channel. Although this value is physically realistic, the calculated gain for the river-aqueduct system in this reach is much higher than the values estimated using the technique described above or values derived from the ground-water flow model described later. A detailed water budget linking the surface-water and ground-water systems as suggested by Danskin (1988), or development of a surface-water/ ground-water model, might help solve this discrepancy.
The specific interactions of the river-aqueduct system with the ground-water system are difficult to measure or estimate. Further improvements in knowledge may require taking advantage of water-quality and temperature measurements of the river—aqueduct and of ground water. These analyses may be useful in confirming concepts and quantities of interactions that are less clearly defined by water-use calculations and water-level mapping, particularly in the complex water-distribution area near Bishop (figure 3).
Spillgates.—Ten spillgates are located along the aqueduct and are used at various times throughout the year to clean the aqueduct of debris and, during highrunoff years, to discharge excess water onto the valley floor. Discharge from the spillgates is measured and is relatively constant in average-runoff years. During most years, total discharge from the 10 spillgates averages about 22,000 acre-ft/yr, but during highrunoff years such as 1967, 1969, and 1983 (figure 12), total discharge can be several times that quantity. Nine spillgates are shown in figure 11; an additional spillgate is located near Cottonwood Creek, just south of the focused area of study. The Cottonwood spillgate was not included in the analysis presented in this report.
Some ground-water recharge occurs as a result of discharge from the spillgates. Although the quantity of discharge is measured, the quantity that infiltrates to the ground-water system is not known. Some of the discharge, especially in high-runoff years, may flow across the valley floor to the channel of the lower Owens River. In a regression analysis of discharge in the lower Owens River, Hutchison (1986d) attributed much of the measured discharge in the lower Owens River at Keeler Bridge (figure 11) to releases from the spillgates.
Discharge of surface water from the spillgates is limited to some extent by litigation (Natural Soda Products Co. v. Los Angeles, 23 California 193) that restricts discharge to the Owens Lake (dry). Occasional wetting of the dry lakebed is believed to contribute to air-quality degradation in the valley caused by dust storms (Saint-Amand and others, 1986; Lopes, 1988). In high-runoff years, these restrictions are difficult or impossible to meet because of the large quantity of water in the valley and the limited capacity of the river-aqueduct system. For example, in the exceptionally wet water years 1969 and 1983 (figure 12), there was water, quite literally, everywhere in the valley and the spillgates were used extensively. Surface water that could not be exported out of the valley was diverted onto the valley floor, primarily through the Blackrock spillgate (figure 11).
During such exceptionally-high-runoff years, infiltration into the unsaturated zone and recharge to the underlying water table may be so great that the infiltration restores the unsaturated zone to field capacity and the recharge reequilibrates shallow groundwater levels from any previous decline caused by nearby pumping or drought. Massive releases from the several spillgates likely play an important role in doing this. Areas of the valley that historically have been inundated with water during high-runoff years are shown on maps compiled by Boyle Engineering and by the Los Angeles Department of Water and Power (M.L. Blevins, written commun., 1986) for 1952, 1967, and 1969.
In this present study, the quantity of infiltration from spillgates was estimated by subtracting the likely losses from evapotranspiration and an estimate of the return flow to the lower Owens River from the measured discharge. Because the discharge channels were observed to have a greater abundance of vegetation than nearby areas on the valley floor, a relatively high evapotranspiration rate of 40 in/yr (Duell, 1990) was used in the calculations. The total recharge to the defined aquifer system (figure 4) from spillgates was estimated to average approximately 6,000 acre-ft/yr.
Lower Owens River
Prior to substantial surface-water diversions in 1913, both surface and ground water migrated to the lower Owens River and eventually discharged into the Owens Lake. As of 1988, nearly all water flowing out of the Tinemaha Reservoir is diverted into the river-aqueduct system, and the lower Owens River has become relatively isolated from other surface-water features of the valley. A photograph of the lower Owens River (figure 10C) taken in summer 1988 shows an abundance of riparian vegetation, especially bulrush and cattails, within the river channel. Typically, the riverbed itself is moist almost to the land surface. Although in some places the lower Owens River has flowing water that continues for several hundred feet, most of the river channel is occupied by this type of riparian vegetation (figure 3).
In average-runoff years, most discharge reaching the Owens Lake (dry) via the lower Owens River is surface water returned to the river from ditches and undiverted tributary streamflow or ground water that seeps into the river channel (Hutchison, 1986d). During extremely wet years, runoff exceeds the capacity of the river-aqueduct system and not all flow in the Owens River is diverted into the Los Angeles Aqueduct. For example, annual discharge in the lower Owens River measured just below the aqueduct intake (station OQFE, table 6; figure 11) for water years 1945—84 was typically 0 acre-ft, but annual discharge for water years 1969 and 1983 exceeded 75,000 acre-ft (L. Lund, Los Angeles Department of Water and Power, written commun., 1988).
Discharge in the lower Owens River also is measured continuously at the Keeler Bridge east of Lone Pine (figure 11). For water years 1927—86, mean annual discharge was about 17,000 acre-ft (Hollett and others, 1991, table 3). Using regression techniques, Hutchison (1986d) evaluated the river-discharge record at the Keeler Bridge for runoff years 1946—86 and concluded that most streamflow at the bridge resulted either from operational releases to the river from the river-aqueduct system or from ground-water discharge. He noted that ground-water discharge in the lower Owens River was affected significantly by bank storage. Sediment along the bank of the river becomes saturated with river water as stage of the river rises, and the stored water then is gradually released back to the river as stage of the river falls. This hydraulic buffering dampens fluctuations in stage and discharge. By separating the various components of discharge, Hutchison (1986d) estimated that the ground-water contributions to the lower Owens River for runoff years 1946—86 ranged from 3,000 to 11,000 acre-ft/yr and averaged about 3,600 acre-ft/yr.
In years of much greater than average runoff (figure 12 and table 7), the lower Owens River probably changes from a gaining stream to a losing stream, thereby recharging the nearby ground-water system, particularly on the east side of the valley. This change is most likely a temporary one; water that is lost will be regained by the river over the next few months or couple of years as the stage in the river channel returns to almost zero. This is essentially the same bankstorage process noted by Hutchison (1986d).
In order to more accurately identify interaction of the lower Owens River with the ground-water system, the Los Angeles Department of Water and Power measured instantaneous discharge during 1986—87 at 10 sites along the river from the aqueduct intake to the Keeler Bridge (Hollett and others, 1991, figure 22). River reaches between the measurement sites were defined as either gaining- or losing-water reaches—although only three of the reaches were found to act in a consistent manner during the period of observations. The first section, a few miles south of the aqueduct intake (Hollett and others, 1991, figure 22), generally lost water to the ground-water system. As discussed in later sections of this report, this loss may correlate with pumpage from wells between Taboose and Thibaut Creeks (figure 11). Gaining reaches near Independence and Lone Pine may result from abundant recharge in the vicinity of Oak Creek, discharge from spillgates (figure 11), and a fining of aquifer materials near Lone Pine. Some of the water gained by the river is discharged as evapotranspiration by the abundant riparian vegetation in the natural channel of the lower Owens River (figure 10C).
Areas surrounding the lower Owens River are shown as having transpiration values ranging from about 0.5 to 1.5 ft/yr (figure 9). These intermediate values are attributed to transpiration by riparian vegetation that has high transpiration rates, often exceeding 3.5 ft/yr (D.P. Groeneveld, Inyo County Water Department, written commun., 1984), mixed with other native vegetation that has lower rates (table 5). In the immediate vicinity of the lower Owens River, transpiration from dense riparian vegetation, such as occupies the river channel (figures 3 and 10C), probably consumes much of the rising ground water that would otherwise flow down the river.
Reservoirs and Small Lakes
Reservoirs
The Pleasant Valley and the Tinemaha Reservoirs are impounded by earth-filled dams and are used to regulate flow in the river-aqueduct system (figure 11). The Pleasant Valley Reservoir is at the mouth of the Owens River gorge, which cuts deeply through the Volcanic Tableland. Nearly all water that normally flowed through the gorge has been diverted into a 96- to 108-inch pipeline (penstock) that passes through three power-generation plants. Water is discharged from the third power plant into the adjacent reservoir, which is about 20 ft deep and covers about 1,700 acres. The reservoir is used primarily as an afterbay for the power-generation facilities and to stabilize flow into the Owens River. Since 1970, when the additional diversions of water from the Mono Basin began, annual inflow to the Pleasant Valley Reservoir has increased by more than 60,000 acre-ft (table 8).
Seepage through the earthen dam that impounds the Pleasant Valley Reservoir undoubtedly occurs although the rate is not known. Any seepage through the dam probably is regained by the Owens River a short distance downstream from the dam. More important, the bottom of the reservoir may contact the more transmissive members of the Bishop Tuff (figure 5; Hollett and others, 1991). If this contact is present and the normal siltation in the reservoir has not restricted direct hydraulic connection between reservoir water and these well-sorted sands, then significant seepage may occur from the reservoir to the ground-water system.
The Tinemaha Reservoir is at the south end of the Bishop Basin, about 5 mi upstream from the intake to the aqueduct (figure 11). The reservoir, which was built in 1929, covers between 0 and 16,000 acres depending on runoff during the particular year (table 7) and is less than 25 ft deep. The reservoir is underlain by moderately transmissive fluvial deposits composed primarily of silt, clay, and sand (figure 4).
Mass-balance calculations for the Tinemaha Reservoir are made each day using gaged outflow (station ONYF, table 6; figure 11) and nearby measurements of pan evaporation. Evaporation from the reservoir in excess of precipitation for water years 1945—84 was estimated to be about 300 acre-ft/yr (station TLRC, table 6). Mean annual pan evaporation for the same period was 92.6 in. (station TLYR, table 6). Measurements were not made that permit a calculation of ground-water recharge from the reservoir. This recharge is caused by the elevated stage of the reservoir in comparison with nearby ground-water levels. Some of the recharge, particularly seepage through the face of the earthen dam, may be gained back into the Owens River just downstream (south) of the reservoir, as in the case of the Pleasant Valley Reservoir. Because of the large values of river inflow and outflow (about 450 ft3/s), any value of ground-water recharge calculated as a residual in a mass-balance equation has a high degree of uncertainty.
To gain a better understanding of the interaction of reservoirs with the ground-water system, detailed maps of surface-water and ground-water contours near each reservoir were developed. Water-level data for 1984 were plotted at a scale of 1:62,500 using a 10-foot contour interval. In the area near the Pleasant Valley Reservoir, few ground-water-level data points were available and, therefore, the contouring was inconclusive. The elevated stage of the reservoir, however, indicates that it was recharging the nearby groundwater system. In the area surrounding the Tinemaha Reservoir, the water-level data clearly indicate a hydraulic gradient from the Owens River, and possibly from the northern part of the Tinemaha Reservoir, to the northwest toward production wells along the edge of Crater Mountain (figure 1). This gradient indicates that, as suggested by T.E. Griepentrog (Buckhorn Geotech, written commun., 1985), surface water from the reservoir was moving into and through the groundwater system in a northwest direction. This direction of movement is just opposite of the natural flow direction prior to increased pumpage in the Big Pine area. Although qualitatively helpful, the contouring methods did not yield reliable estimates of the quantity of recharge.
Water quality of outflow from the Tinemaha Reservoir was sampled bimonthly during 1974—85 as part of the USGS National Stream Quality Accounting Network. The principal ions found in the samples were calcium (the predominant cation), sodium, bicarbonate (the predominant anion), and sulfate. Total concentration of dissolved solids ranged from 66 to 274 mg/L, with a mean of 181 mg/L (Hollett and others, 1991, table 4). This particular sampling point indicates the quality of water emanating from the reservoir and may reflect some changes in chemical and physical properties because of residence time in the reservoir. Comparison of these data with data from nearby ground water may aid in understanding the dynamics of flow between the reservoir and the ground-water system. However, it is likely that additional surface-water and ground-water samples would be needed for the comparison. A similar analysis of water quality in and around the Pleasant Valley Reservoir would help answer similar questions of seepage rates and flow directions in that area.
Small Lakes
Several small lakes, including Klondike, Warren, and Diaz Lakes (figures 3 and 11), are present in the Owens Valley. Diaz Lake and, more recently, Klondike Lake have been used for recreation, including fishing and the use of motor boats. To accommodate this usage, water levels in Klondike and Diaz Lakes have been maintained within a fairly narrow range by the diversion of water from nearby tributary streams and canals.
Prior to being used and managed for recreation in 1986, Klondike Lake functioned much as does Warren Lake. Under unmanaged conditions, water levels in both lakes fluctuate markedly from one season to another and from one year to another depending on the quantity of runoff and the altitude of nearby ground-water levels. During above-average runoff years (figure 12 and table 7), the lakes fill; during drier periods, the lakes empty as a result of local withdrawals and evapotranspiration.
Because the lakes are topographically low points, they most likely are natural ground-water discharge areas under unmanaged conditions. During wet periods, the lakes receive an influx of water and probably act as localized recharge points to the groundwater system. In general, this type of recharge will be temporary—as the water level in the lake falls, the hydraulic gradient from the ground-water system to the lake is reestablished, and the ground-water system resumes draining. This cyclical process is similar to that observed for the lower Owens River.
Detailed analysis of the small lakes and the surrounding ground-water system is beyond the scope of the present study. However, as an aid in determining local recharge and discharge relations, water-level data were plotted at a scale of 1:62,500 using a 10-foot contour interval as was done in analyzing the reservoirs. No indications of recharge from or discharge to the lakes were evident. The absence of a noticeable hydraulic gradient suggests that the rates of exchange with the ground-water system probably are small and localized in comparison with the more dominant controls on ground-water flow, such as recharge from tributary streams and discharge to the Owens River.
Although the small lakes do not seem to have a major effect on the valleywide hydrologic system, they can be locally important. For example, Klondike Lake is north of production wells near Big Pine and may buffer the effects of pumping, much as the Tinemaha Reservoir does to the south. As pumpage increases and ground-water levels decline, additional recharge will be induced from Klondike Lake, thereby minimizing ground-water-level declines and increasing recharge to the ground-water system. The presence of fine-grained, lake-bottom sediment will inhibit, but not prevent, recharge. Similarly, Diaz Lake may provide an important source of ground-water recharge for the Lone Pine area, including the Lone Pine town-supply wells.
Canals, Ditches, and Ponds
Canals and Ditches
A complex network of canals and ditches, particularly near Bishop, have been used to convey water for irrigation, livestock, and ground-water recharge (figures 3 and 11). The canals and ditches range in length from tens of feet to tens of miles and, although some channels are lined with broken rock or concrete, most have sides and bottom composed of native earth. The original purpose of many of the ditches in the Bishop area was to drain the soil so that the land could be farmed. Agricultural activities, begun in the late 1800's, increased rapidly and by 1920 there were about 24,000 acres of cultivated crop land and 51,000 acres of flood-irrigated pasture land (D.E. Babb, Los Angeles Department of Water and Power, written commun., 1988).
By 1978, irrigated farmlands had declined to about 17,000 acres, largely as a result of land purchases by the Los Angeles Department of Water and Power and subsequent retirement of land from irrigated use. Over the past 75 years in the Owens Valley, the net result of many separate changes in land use has been a general shift toward less local consumption of water (table 4; Hollett and others, 1991, figure 5).
Changes in land use, beginning about 1968, affected the operation of canals and ditches. Although less land was being farmed, the allocation of water to the remaining farms and ranches was more certain. The few canals and ditches that remained in operation had a more constant flow rate during each year, and from year to year (R.H. Rawson, Los Angeles Department of Water and Power, oral commun., 1988). With more uniform conditions, recharge from the canals and ditches to the ground-water system probably also was more uniform.
As of 1988, most of the canals and ditches in the Owens Valley are used conjunctively for purposes of flood control, irrigation, stockwater, recreation, wildlife habitats, and spreading of water for recharge. The Bishop area has the highest density of canals and ditches, and most of the larger ones are operated during most of the year (figure 11). South of Bishop, canals and ditches are concentrated in agricultural areas near the towns of Big Pine and Lone Pine, and in the vicinity of Oak Creek near Independence (figure 3).
Parts of the Owens Valley that no longer have active farms or ranches, such as east of Independence, still have remnant canals and ditches. Some of the canals and ditches are marked by occasional trees. The ditches typically are the lowest point of the local land surface and determine the highest altitude of groundwater levels. Ground water rising to a higher altitude is drained. In extremely-high-runoff years, such as 1969 and 1983 (table 7), dormant canals and ditches in the areas south of Bishop and east of Independence are used by the Los Angeles Department of Water and Power to disperse excess surface water.
The complex and confusing array of canals and ditches in the Bishop area (figure 3) makes detailed analysis difficult. Computations of surface-water and ground-water budgets are probably less reliable than those made for other parts of the valley. To help overcome this complexity, the Los Angeles Department of Water and Power maintains more than 500 continuously recording gaging stations on the canal and ditch system. The stations generally are equipped with a Parshall flume and recording float (R.H. Rawson, Los Angeles Department of Water and Power, oral commun., 1987). Most of the stations are used to document the quantity of water delivered to individuals who lease lands from the Los Angeles Department of Water and Power.
The specific interaction of each canal and ditch with the ground-water system is not documented, but estimates can be made by comparing measurements of discharge at the different gages and subtracting estimates of water use between the gages. Using this approach, the Los Angeles Department of Water and Power (R.H. Rawson, written commun., 1988) concluded that most of the canals lose water to the groundwater system. This interaction is just the opposite from that observed when the valley was first developed for farming in the late 1800's, when many of the canals were built to drain the soil. Some localized sections of canals, particularly in the Bishop area, may still operate as drainage ditches.
The quantity of ground-water recharge from canals and ditches varies from one year to the next depending on operating conditions. Data for the larger canals and ditches, such as the North (upper) McNally and the Big Pine Canals (figure 11), indicate that loss rates of as much as 1.1 (ft3/s)/mi can be sustained over a period of several months. These larger conveyances typically have water flowing in them continuously except for brief periods of maintenance. Most of the water flowing in them and the related recharge is from diversions of tributary streams and the Owens River. However, during some periods, ground-water pumpage is the only source of water routed into some sections of the canals. Recharge under these conditions is a localized recycling of ground water. This condition is most common for the South (lower) McNally Canal, which has a series of wells spaced along its banks (figure 11).
Riparian vegetation growing in and along the canals and ditches withdraws water from the soilmoisture zone and reduces the quantity of seepage that actually enters the ground-water system. This reduction in actual recharge was found to be minimal [less than 0.02 (ft3/s)/mi] using calculations based on estimates of the width of vegetation (5 to 20 ft), percentage of vegetation cover (30 to 100 percent), and evapotranspiration (40 to 60 in/yr).
An estimate of recharge was made for each of the 19 larger canals and ditches, which have individual names such as the Owens River Canal. The largest of these are shown in figure 11; all 19 canals and ditches are shown on USGS 1:24,000-scale topographic maps compiled by the Los Angeles Department of Water and Power (R.H. Rawson, written commun., 1987). Recharge was calculated using measured and estimated loss rates, the measured length of the channel, and the average period of operation. Typically, the canals and ditches lost about 0.7 (ft3/s)/mi and were operated all year. Total recharge from the named canals and ditches within the defined aquifer system (figure 4) was estimated to average about 20,000 acre-ft/yr.
Many smaller, unnamed canals and ditches have a lower loss rate because of a smaller wetted perimeter and lesser depth of water. The recharge from these conveyances was lumped into the values of groundwater recharge from irrigation and watering of livestock discussed in later sections of this report.
The effect on native vegetation from operation of the canals and ditches is not well documented. In general, however, when a canal or ditch is taken out of service, as was the Owens River Canal (figure 11) after 1969, recharge to the ground-water system is reduced and the quantity of water available for evapotranspiration in the immediate vicinity of the canal is less. This change may be visible as a reduction in the quantity of leaves or possibly the number of plants (Groeneveld and others, 1986b) in the immediate vicinity of the canal or ditch. If the canal or ditch is elevated above the water table, then similar effects can be expected to occur toward the center of the valley where the water table is closer to the rooting depth of native vegetation.
Ponds
Several ponds are operated in the valley, usually in conjunction with canals and ditches, for wildlife habitat and as areas to contain operational releases of surface water or to purposefully recharge the groundwater system. Some of the pond-like areas are referred to as sloughs, although the distinction generally is not important. Sloughs, which are referred to as ponds in this report, tend to be areas with a more undulating topography and a less-well-defined shoreline. The primary areas of ponds are Farmer's Ponds north of Bishop; Buckley Ponds, Arkansas Flats, Runkle Slough, and Partridge Slough south of Bishop; Thibaut Ponds near Thibaut Creek; Calvert Slough near Taboose Creek; and Billy Lake east of Independence. The location of these areas is shown on USGS 1:24,000-scale topographic maps and on land-use maps compiled by the Los Angeles Department of Water and Power (R.H. Rawson, written commun., 1987). The quantity of discharge to these areas varies with the quantity of runoff in the valley (table 7). In years with below-normal runoff, little or no water is diverted except to the few migratory-bird habitat areas, such as Farmer's Ponds. In years with unusually high quantities of runoff, the ponds are flooded with tens of thousands of acre-feet of water.
After operation of the second aqueduct was begun in 1970, purposeful recharge operations were emphasized in order to help balance the increased quantity of ground water pumped. Whenever extra surface water is available, in excess of the demands for wildlife habitat, it is diverted to areas with the most favorable ground-water-recharge characteristics. During high-runoff years, such as 1978, just the purposeful ground-water recharge from those areas has been estimated to be as much as 25,000 acre-ft (R.H. Rawson, Los Angeles Department of Water and Power, written commun., 1988). During average and belowaverage runoff years (figure 12 and table 7), the total quantity of recharge from ponds is much less.
Annual recharge from each pond was estimated from an annual water-use summary obtained from the Los Angeles Department of Water and Power (R.H. Rawson, written commun., 1988). In this unpublished summary, water use is tabulated by area of the basin (Laws, Bishop, Big Pine, Tinemaha—Haiwee) and by category of water use (operational, ground-water recharge, recreation and wildlife, enhancement and mitigation). In general, operational use is defined as water that is released from the river-aqueduct system for safety or maintenance reasons; ground-water recharge is defined as water used to purposefully maximize recharge of the aquifer system; recreation and wildlife is defined as surface water released to meet the needs of wildlife, primarily birds; enhancement and mitigation is defined as water designed to meet the needs of vegetation in selected areas.
With the considerable aid of R.H. Rawson, percentages were chosen to split the summary values for each area into values for individual ponds (or pondlike areas). For example, water used in the Laws area for operational purposes is distributed to three ponds: south of the North (upper) McNally Canal, south of the South (lower) McNally Canal, and near the Laws Ditch (figure 11). The average percentage distribution to each pond was estimated to be 40 percent, 40 percent, and 20 percent, respectively.
Also with the aid of R.H. Rawson, a recharge rate was estimated for each pond and use of water. For example, recharge from an operational release of water to the pond near the Laws Ditch was estimated to be about 20 percent of the total water released. In contrast, recharge from water designated as ground-water recharge in the same pond was estimated to be about 75 percent. This large difference in recharge rates for the same physical area results from the specific conditions, timing, and volume of the release of water. The extensive gaging-station records maintained by the Los Angeles Department of Water and Power aided in confirming the reasonableness of the estimates for water distribution and recharge. From these estimates, annual recharge was calculated for 28 different combinations of ponds and water use for water years 1970—88.
Tabulated summaries for years prior to 1970 were not available from the Los Angeles Department of Water and Power. Therefore, correlations between the 1970—88 data and the percent valleywide runoff were used to determine values of water distribution and recharge for water years 1963—69. Because changes in definitions and categories occurred during the period 1970—88, such as between "operational releases" and "ground-water recharge," some judgement was required in assigning the earlier values. Average recharge from all ponds within the defined aquifer system (figure 4) was estimated to be 12,000 acre-ft/yr during water years 1963—69 and 11,000 acre-ft/yr during water years 1970—84.
Owens Lake
The Owens Lake is the terminus for the natural surface-water system (figures 1, 3, 10D, and 11). Runoff that is not diverted into the Los Angeles Aqueduct, recharged to the ground-water system, or evapotranspired eventually flows onto the Owens Lake playa and is evaporated.
Historically, the Owens Lake was as much as 20 ft deep, and steam-powered ferry boats crossed it. As of 1988, the lake was dry, except for a small area near the northwestern side. Spring discharge into the lake is visible along the northwestern shore—presumably ground-water discharge from the area west of the Alabama Hills. During the high-runoff year of 1983 (figure 12), the lake occupied nearly the entire area of the playa shown in figures 1 and 10D, but it evaporated almost entirely within a single year. Not surprisingly, lake water and nearby ground water have exceptionally high concentrations of dissolved solids (Hollett and others, 1991; Lopes, 1988).
Although not a part of the detailed study area for this investigation, the Owens Lake remains a major factor in water-management operations within the Owens Valley. The restriction on the Los Angeles Department of Water and Power from discharging water into the lake and the occurrence of huge dust storms, which are believed to be related to rewetting of the playa and which occasionally extend from the area of the Owens Lake to north of Independence, are ongoing topics of investigation (Saint-Amand and others, 1986; Lopes, 1988).
Questions about Owens Valley Hydrogeology? Please contact Wes Danskin (email or address). 619.225.6132
California Water Science Center Home Page