
National Water-Quality Program
GAMACTT (v1.0) - GAMACTT Guide
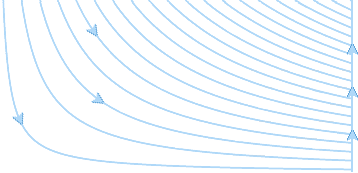
Groundwater Age Mixture in Well1,2
- Units (m):
- Aquifer Properties
- (m):
- :
- (m/yr):
- 3 (m):
- Well Configuration
- (m):
- (m):
- 3 (m):
- Mean Age of Water in Aquifer (yrs):
- Mean Age of Water in Well (yrs):
- Youngest Age of Water in Well (yrs):
- Oldest Age of Water in Well (yrs):
- Age Span of Water in Well (yrs):
- PEM Ratios for use in TracerLPM1:
- Upper Ratio (m):
- Lower Ratio (m):
Contaminant Simulation2,4
- Contaminant Input5
- :
- :
- :
- :
- Contaminant Degradation6
- (1/yr):


GAMACTT (Version 1.0): Groundwater Age Mixtures and Contaminant Trends Tool.
Note: This webtool is designed to guide users through the process of evaluating how groundwater age distributions and changing contaminant inputs affect contaminant trends in wells and other groundwater discharges (Böhlke and others, 2014). As the aquifer model and calculations are idealized and highly simplified, the webtool is intended for educational use and should not be used for predictive purposes. GAMACTT is intended to be used online; if preferred, a downloadable version can be found at the following link:
GAMACTT Downloadable Standalone Version (requires Chrome browser)
An Excel® workbook for interpreting groundwater age distributions from environmental tracer data: U.S. Geological Survey Techniques and Methods Report 4-F3, 60p.
Use this USGS Groundwater Age Mixtures and Contaminant Trends Tool to explore the effects of basic aquifer properties and well configurations on groundwater age mixtures in groundwater discharge and on contaminant trends from varying nonpoint-source contaminant input scenarios.
Guide Resources
Description of webtool and example applications.
NOTE: This tool has been optimized for use in Chrome. Other browsers may not display the web page properly.
Document Accessibility: Part or all of these reports are presented in Portable Document Format (PDF); the latest version of Adobe Reader or similar software is required to view. Download the latest version of Adobe Reader, free of charge
![]() U.S. Department of the Interior | U.S. Geological Survey
U.S. Department of the Interior | U.S. Geological Survey
URL: http://ca.water.usgs.gov/projects/gamactt/index.html
For Page Information: Send Us a Message
Page Last Modified: Wednesday, 28-Dec-2016 11:55:40 EST