Mojave Groundwater Resources
Land Subsidence in the Mojave River and Morongo Groundwater Basins, Southwestern Mojave Desert, California, 2014–2019
By Justin T. Brandt and Michelle Sneed
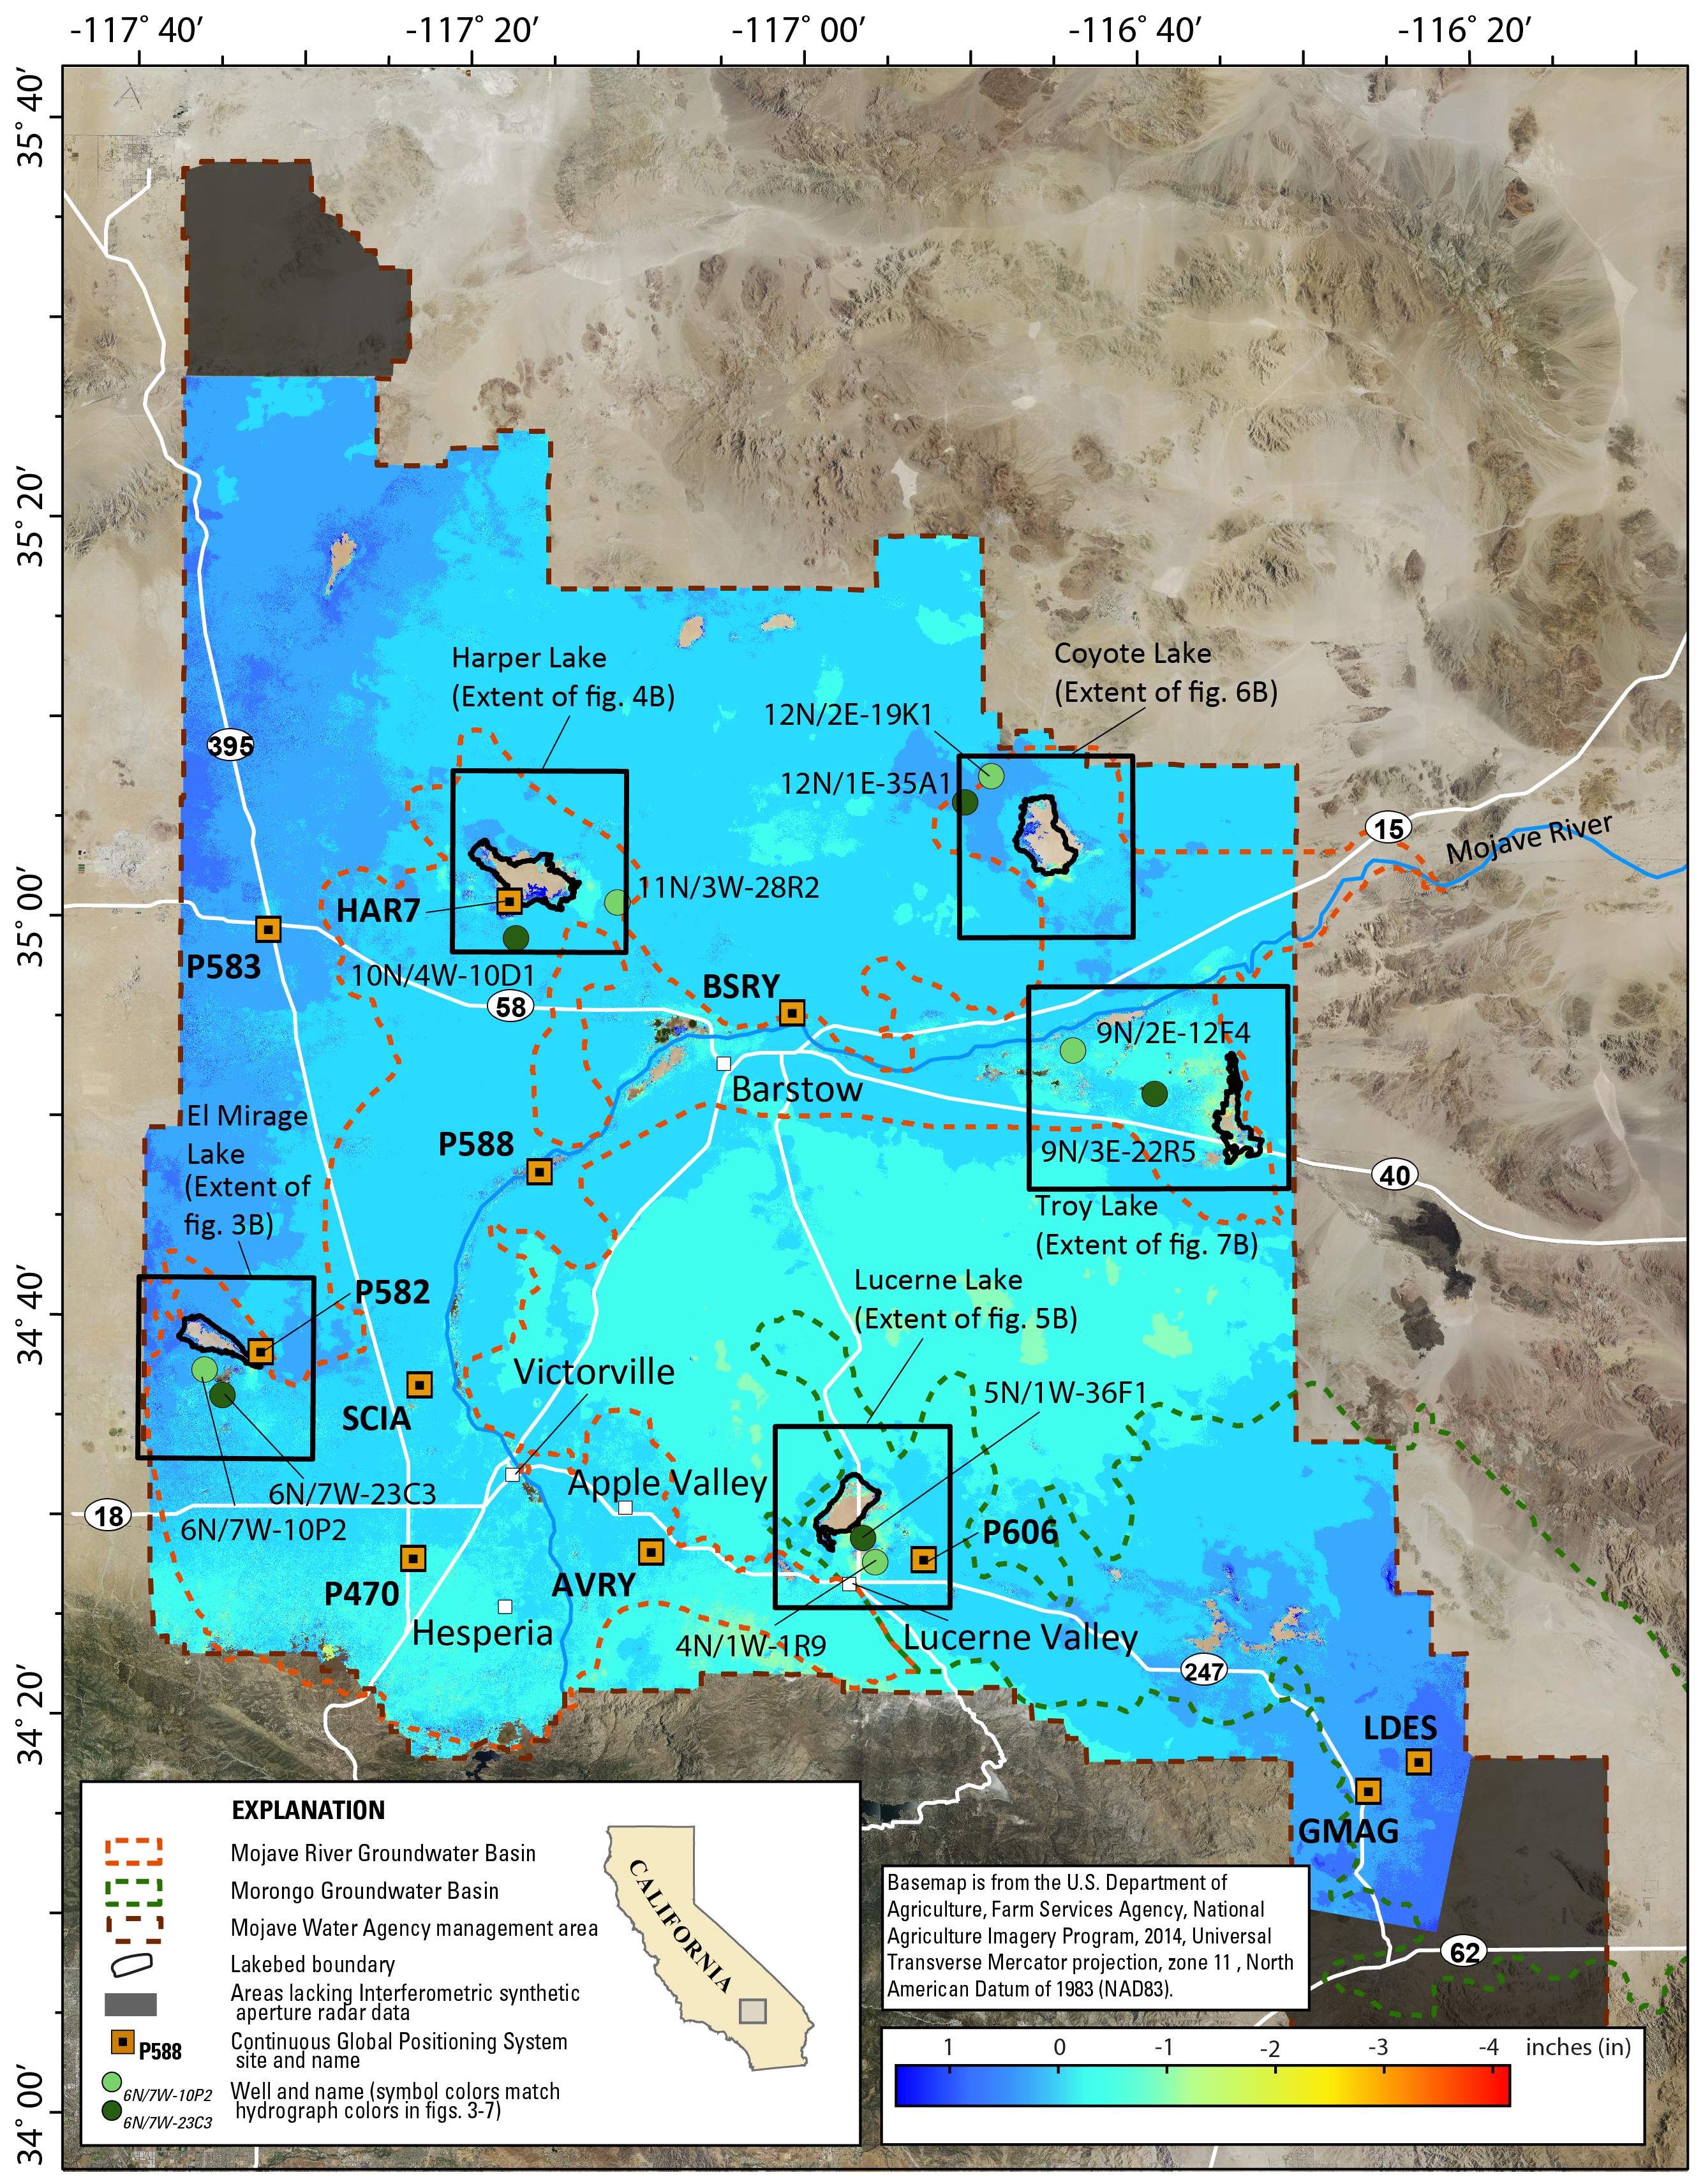
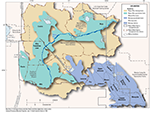
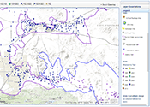
Figure 1. Study area, boundaries of the Mojave River and Morongo groundwater basins, the Mojave Water Agency management area, and other features on a composite interferogram for December 2014–March 2019, southwestern Mojave Desert, California. Insets show extents of figures 3B-7B. Subsidence generally occurred near the eastern edge of Harper Lake, the western edge of Troy Lake, the southern edges of Coyote Lake and El Mirage Lake, and south of Lucerne Lake. Blank areas in interferogram were masked because of low pixel correlation. Base map is National Agriculture Imagery Program (NAIP) imagery from 2014.
Introduction
This report is the fifth in a series of land subsidence reports for the southwestern Mojave Desert produced by the U.S. Geological Survey (USGS) in cooperation with the Mojave Water Agency (MWA). The first three reports describe subsidence and groundwater levels during 1944–99 (Sneed and others, 2003), 1999–2004 (Stamos and others, 2007), and 2004–09 (Solt and Sneed, 2014). The fourth report combines groundwater-level data and Interferometric Synthetic Aperture Radar (InSAR) derived subsidence for 1992–2009 with lithology from the three previous subsidence reports and distills the data and analyses into a longer-term context (Brandt and Sneed, 2017).
The purpose of this report is to document groundwater levels and land subsidence during 2014–19 and to combine the results with previous analyses to generate a nearly 30-year examination of groundwater levels and InSAR-measured land subsidence for the MWA management area in the southwestern Mojave Desert (fig. 1). The groundwater-level data are available at the USGS National Water Information System Website. InSAR-derived land subsidence data discussed in this report are integrated into the broader scoped USGS Mojave Groundwater Resources Website, which includes an interactive map.
Approach
Synthetic aperture radar (SAR) data from the European Space Agency's (ESA) Sentinel-1A satellite were acquired for this study from the Alaska Satellite Facility and used to generate spatially detailed land-surface deformation maps (interferograms) for the Mojave River and Morongo groundwater basins during 2014–19 using InSAR methods. For this study, a total of 304 interferograms were produced, and about one-third of these interferograms were selected for further quality assessment. InSAR results are compared to groundwater levels and lithology in a historical context to better understand the hydromechanical response of the aquifer system.
The quality of the interferograms was assessed qualitatively and quantitatively. The qualitative assessment focused on identifying non-persistent deformation signals, which were attributed to artifacts (such as those caused by variable atmospheric moisture) or processes (such as farming) that are unrelated to aquifer-system compaction. The quantitative assessment compared InSAR results for 2014–19 to continuous GPS (CGPS) results provided by the Scripps Orbit and Permanent Array Center (2019) at 11 CGPS sites distributed throughout the Mojave River and Morongo groundwater basins (fig. 1). Magnitudes of vertical displacement (subsidence or uplift) derived from CGPS and InSAR analyses generally were directly compared because CGPS results are available for most days during the operational history of the CGPS site (fig. 2). Data gaps spanning several days or months and relatively short periods of record at CGPS sites HAR7 and GMAG prevented direct comparison of InSAR results during some periods (figs. 2e and 2k).
Day-to-day CGPS results varied by about 1.2 inches (in.) or more, which is likely the result of variable atmospheric moisture, noise, and other effects not directly related to land-surface deformation (Zerbini and others, 2001; Williams and others, 2004; Langbein, 2008). To minimize this high-frequency noise and to enable better comparison between CGPS and InSAR results, a 31-day moving average was applied to the CGPS results. The application of this moving average did not remove seasonal or long-term deformation trends and permitted more meaningful comparisons with InSAR results, even during short (~1-day) gaps in CGPS data (fig. 2). Furthermore, CGPS results at the 11 sites indicated general stability between 2014 and 2019 (fig. 2), indicating that regional deformation associated with tectonic plate movement did not substantially contribute to the localized elevation changes measured using InSAR during this period.

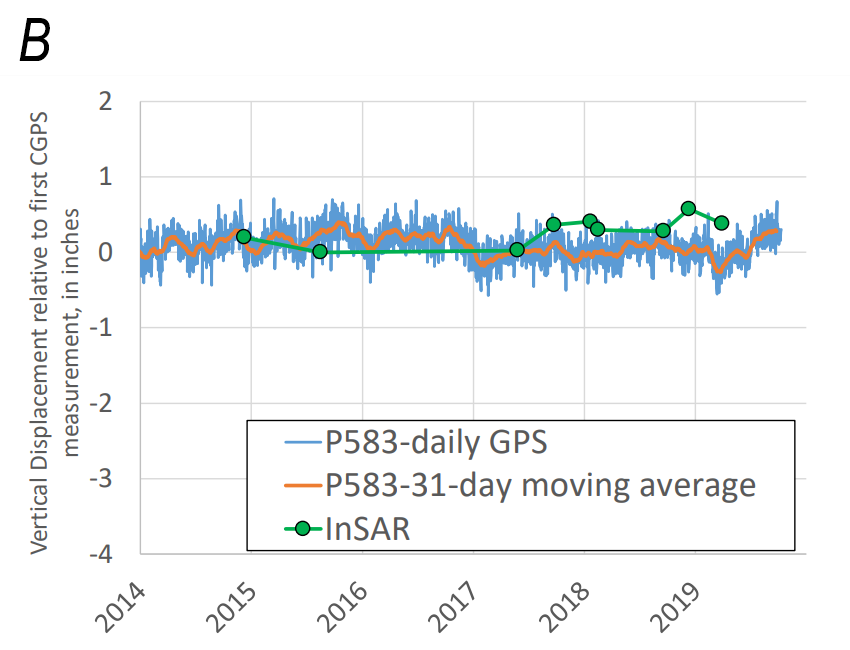
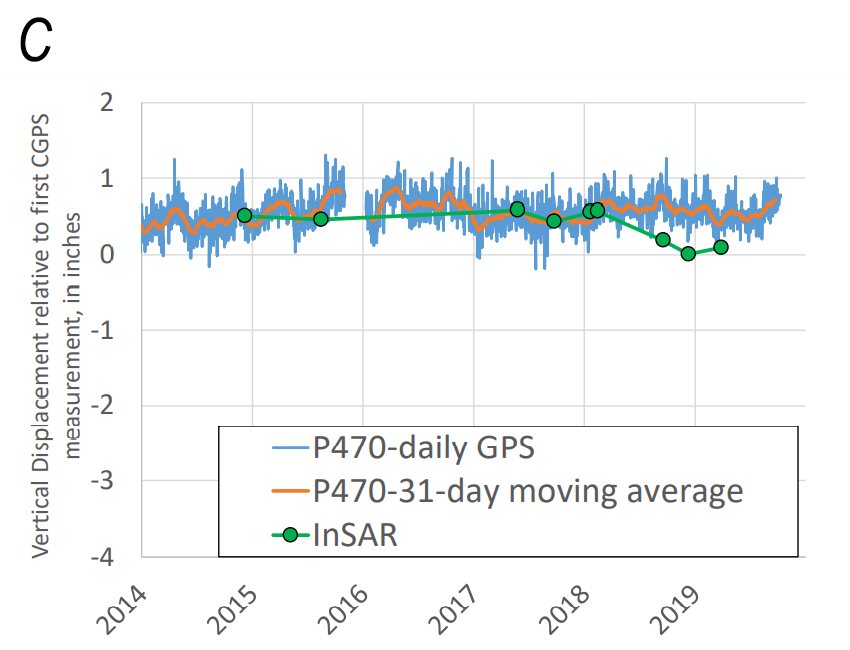
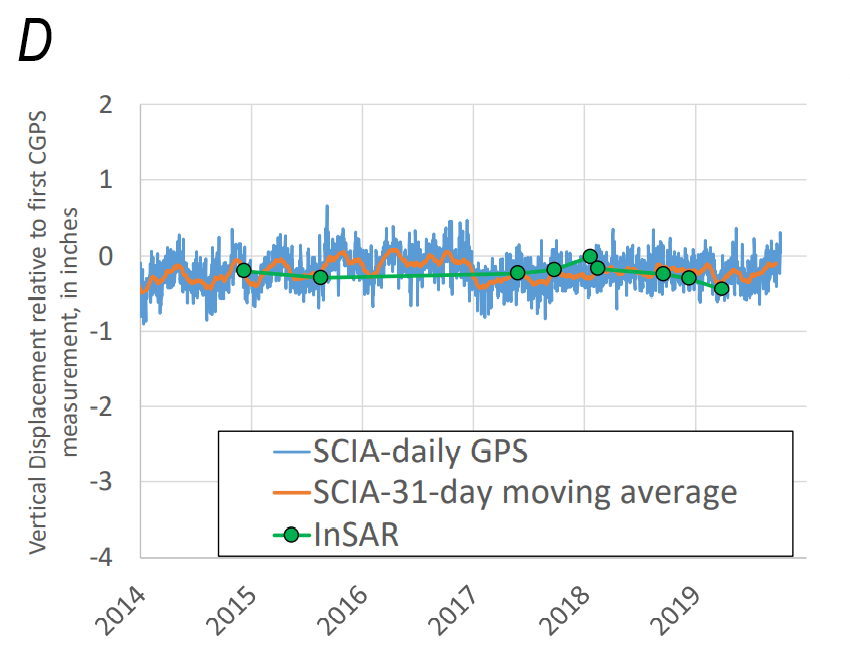
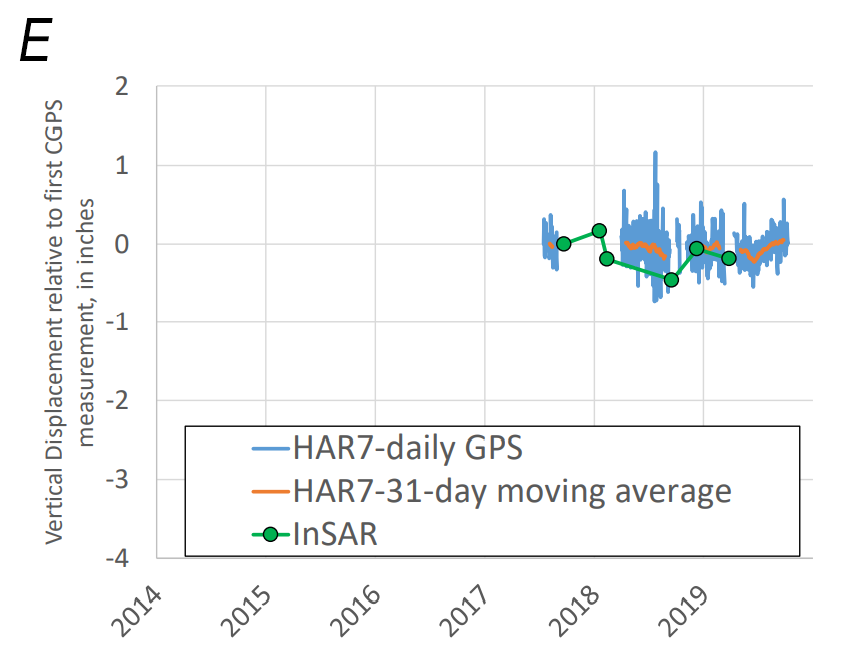
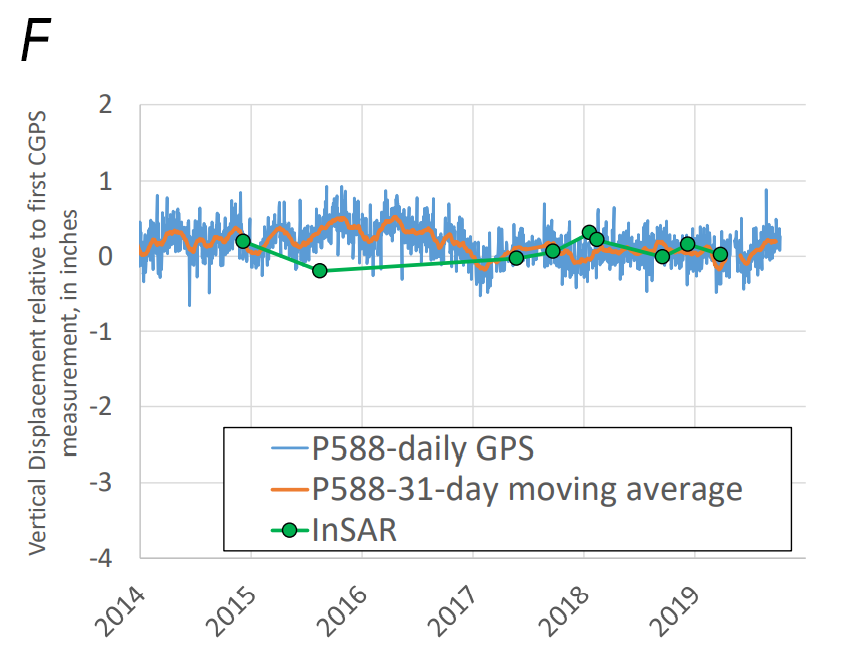
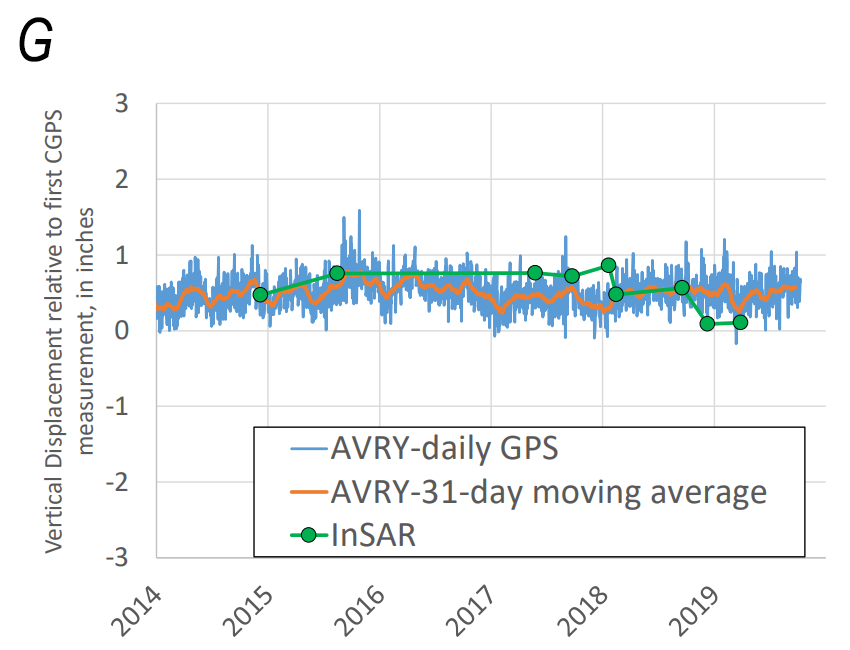
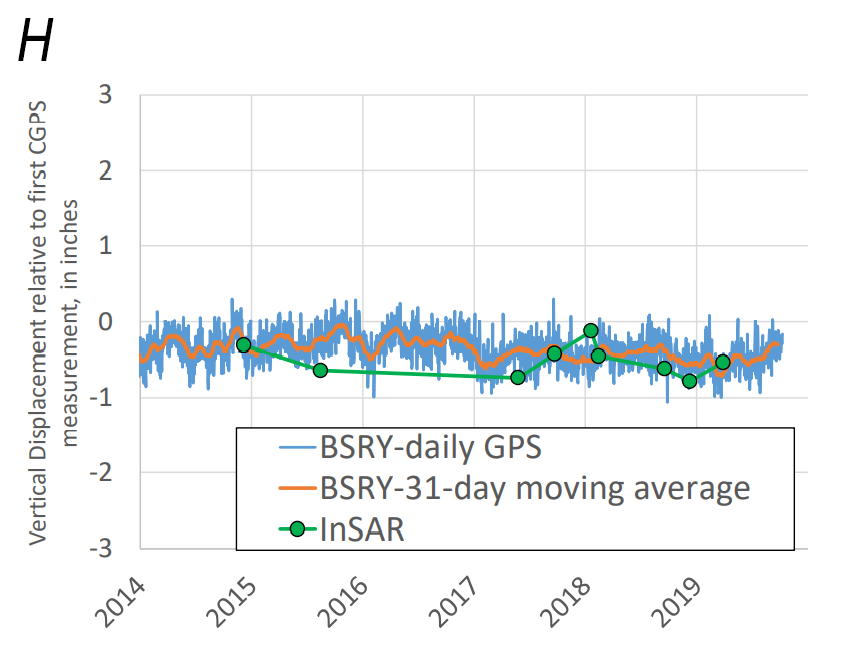
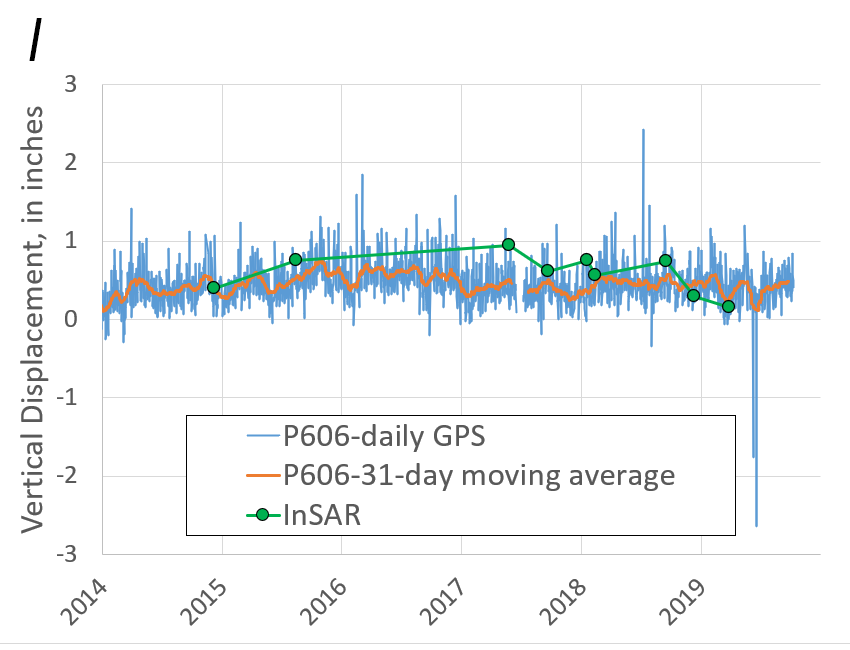
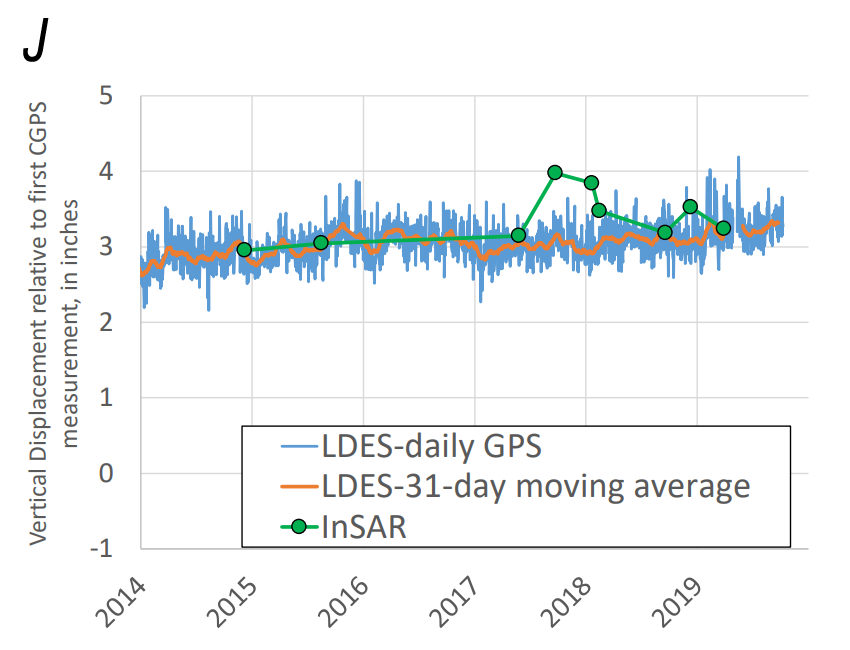
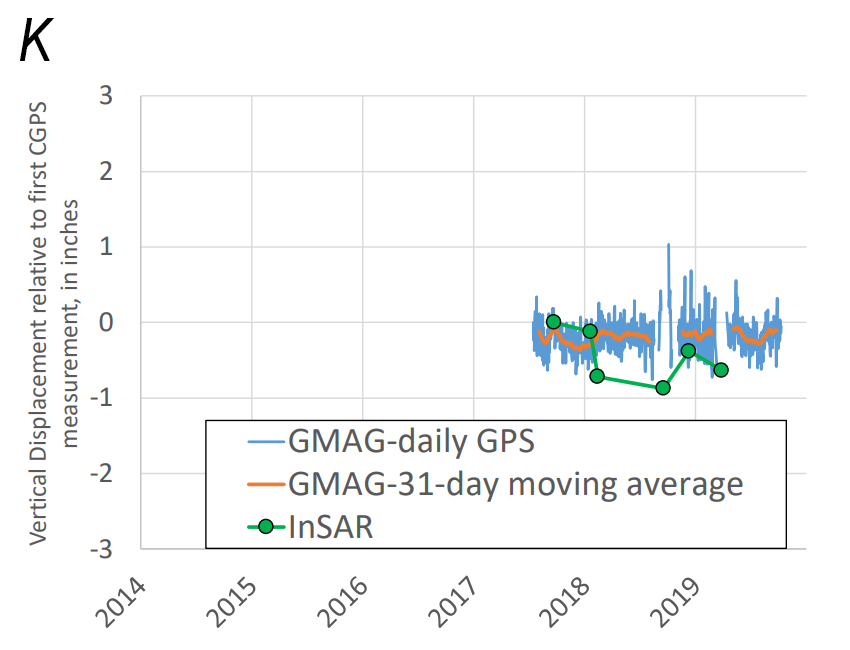
Table 1: Interferograms interpreted for the Mojave River and Morongo groundwater basins, southwestern Mojave Desert, California, 2014–19.
[Index number is a unique identifier assigned to each interferogram. Abbreviations: SAR, Synthetic aperture radar; mm/dd/yyyy, month/day/year date format].
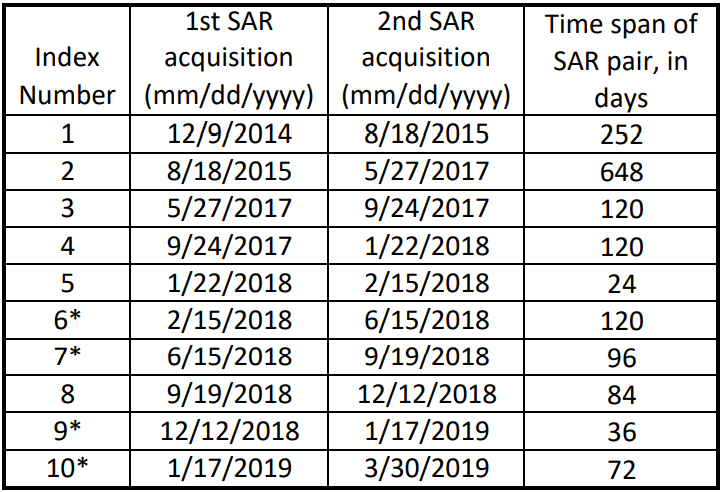
*Denotes interferogram with suspected phase delays from clouds or fog which were mitigated using compositing techniques.
Interferometric Synthetic Aperture Radar Results
The qualitative and quantitative interferogram assessments resulted in the selection of 10 time-sequential interferograms for detailed analyses (table 1). The interferograms span between 24 and 648 days during December 2014–March 2019. Four of these interferograms (index numbers 6, 7, 9, and 10; table 1) showed suspected phase delays from clouds or fog. As described in the InSAR methods, a composite interferogram was generated from each pair of interferograms that share a common SAR image to remove the erroneous deformation that was attributed to atmospheric artifacts. Combining the 6 individual interferograms with the 2 composite interferograms resulted in 8 InSAR interferograms during this period. Once suspected atmospheric delays were mitigated, a comparison of 72 InSAR and CGPS values indicated that more than 94 percent agreed within 0.5 in. with a root mean square error of less than 0.3 in.
The eight interferograms (6 individual and 2 composite) were analyzed individually and used to construct time series at selected locations. These interferograms also were analyzed collectively as a composite interferogram representing the more than 4-year span of the eight interferograms. These interferograms reveal deformation in the same areas as reported by Brandt and Sneed (2017), and are associated with lakebeds: El Mirage Lake, Harper Lake, Lucerne Lake, Coyote Lake, and Troy Lake (fig. 1). Deformation greater than the expected error (0.5 in.) was not detected in other areas of the MWA management area (for example, near the cities of Victorville, Hesperia and Apple Valley, and CGPS sites P470 and AVRY; figs. 1, 2C, and 2G). The time-series analyses for 2014–19 were then combined with the time-series analyses for 1992–2009 documented in Brandt and Sneed (2017) to form a nearly 30-year history of InSAR-measured land-surface deformation (figs. 3-7).
El Mirage Lake
Observation
- About 1 in. of subsidence occurred during 2014–19, resulting in a total of about 9 in. of subsidence during 1995–2019 (fig. 3A).
- The average subsidence rate was about 0.25 inches per year (in/yr) during 2014–19, which is less than the nearly 0.45 in/yr rate during measured 1995–2009 (Brandt and Sneed, 2017).
- The extent of subsidence during 2014–19 (fig. 3B) was similar to the extent during 1995–2009 (Brandt and Sneed, 2017).
- Groundwater levels in shallower wells generally declined (for example, 6N/7W-10P2); water levels in deeper wells fluctuated seasonally and increased (for example, 6N/7W-23C3) during 2014–19 (fig. 3A).
- Clay layers ranging from 5 to 295 ft in thickness are present in the shallow and deep parts of the aquifer system near the subsiding area (Huff and others, 2002).
Discussion
- If compaction occurred in the shallow part of the aquifer system during 2014–19, it could be partly concurrent because groundwater levels declined during this period, and may be partly residual, depending on historical water levels (prior to the 1980s) which are not well understood.
- If compaction occurred in the deep part of the aquifer system during 2014–19, it likely was residual because water levels (at depth) were increasing when subsidence was measured.
- The reduced rate of subsidence during 2014–19 likely is partly related to the groundwater-level increases in the deeper part of the aquifer system, which contrasts the decline in groundwater levels observed from 1998 to 2009. Groundwater-level increases cause some parts of an aquifer system to expand, offsetting some of the continued compaction in other parts of an aquifer system.
- The 1 in. of subsidence that occurred during 2014–19 may be partly recoverable; small magnitudes of subsidence can be recoverable (elastic).
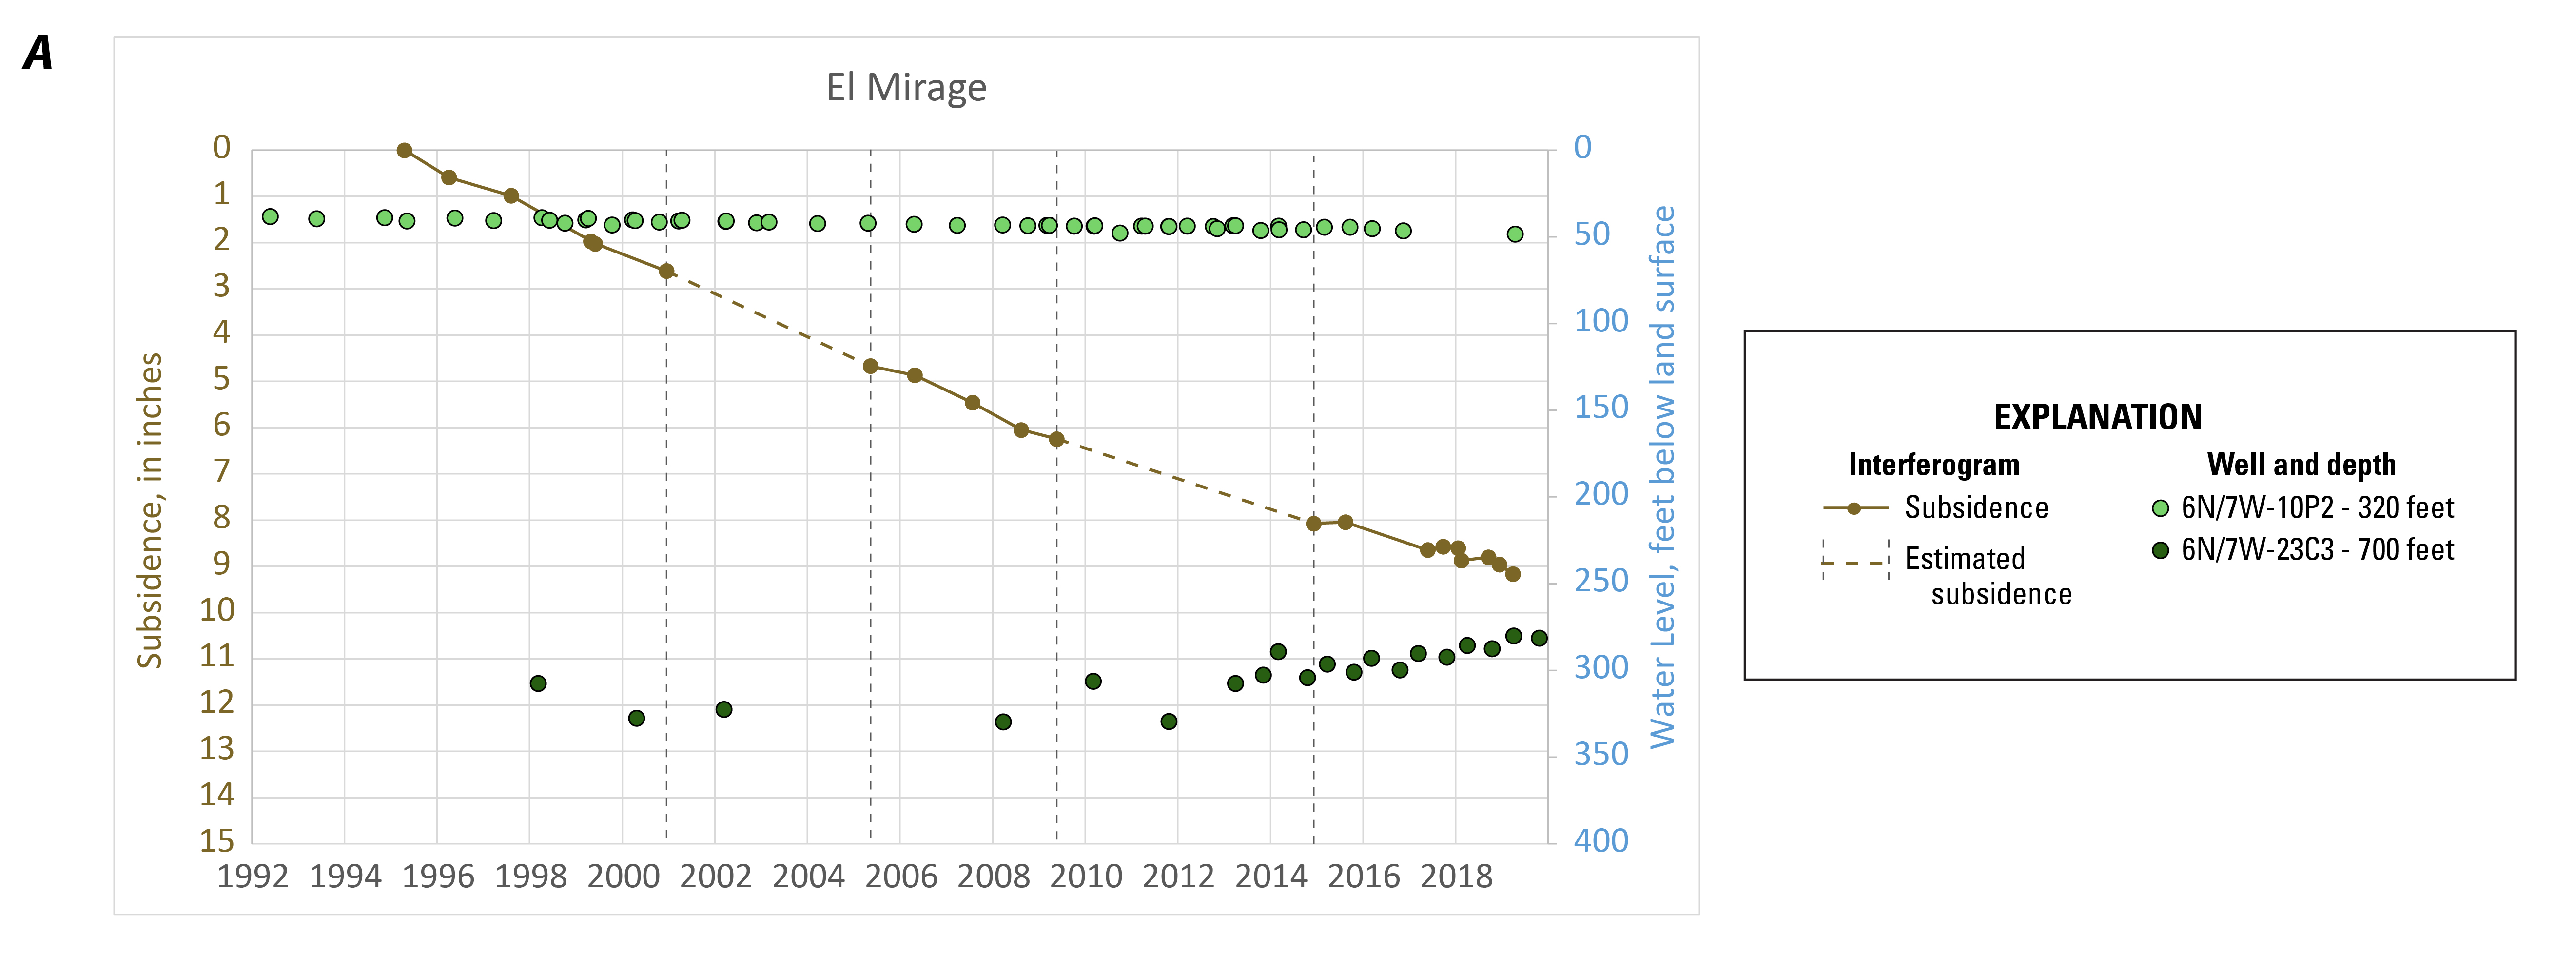
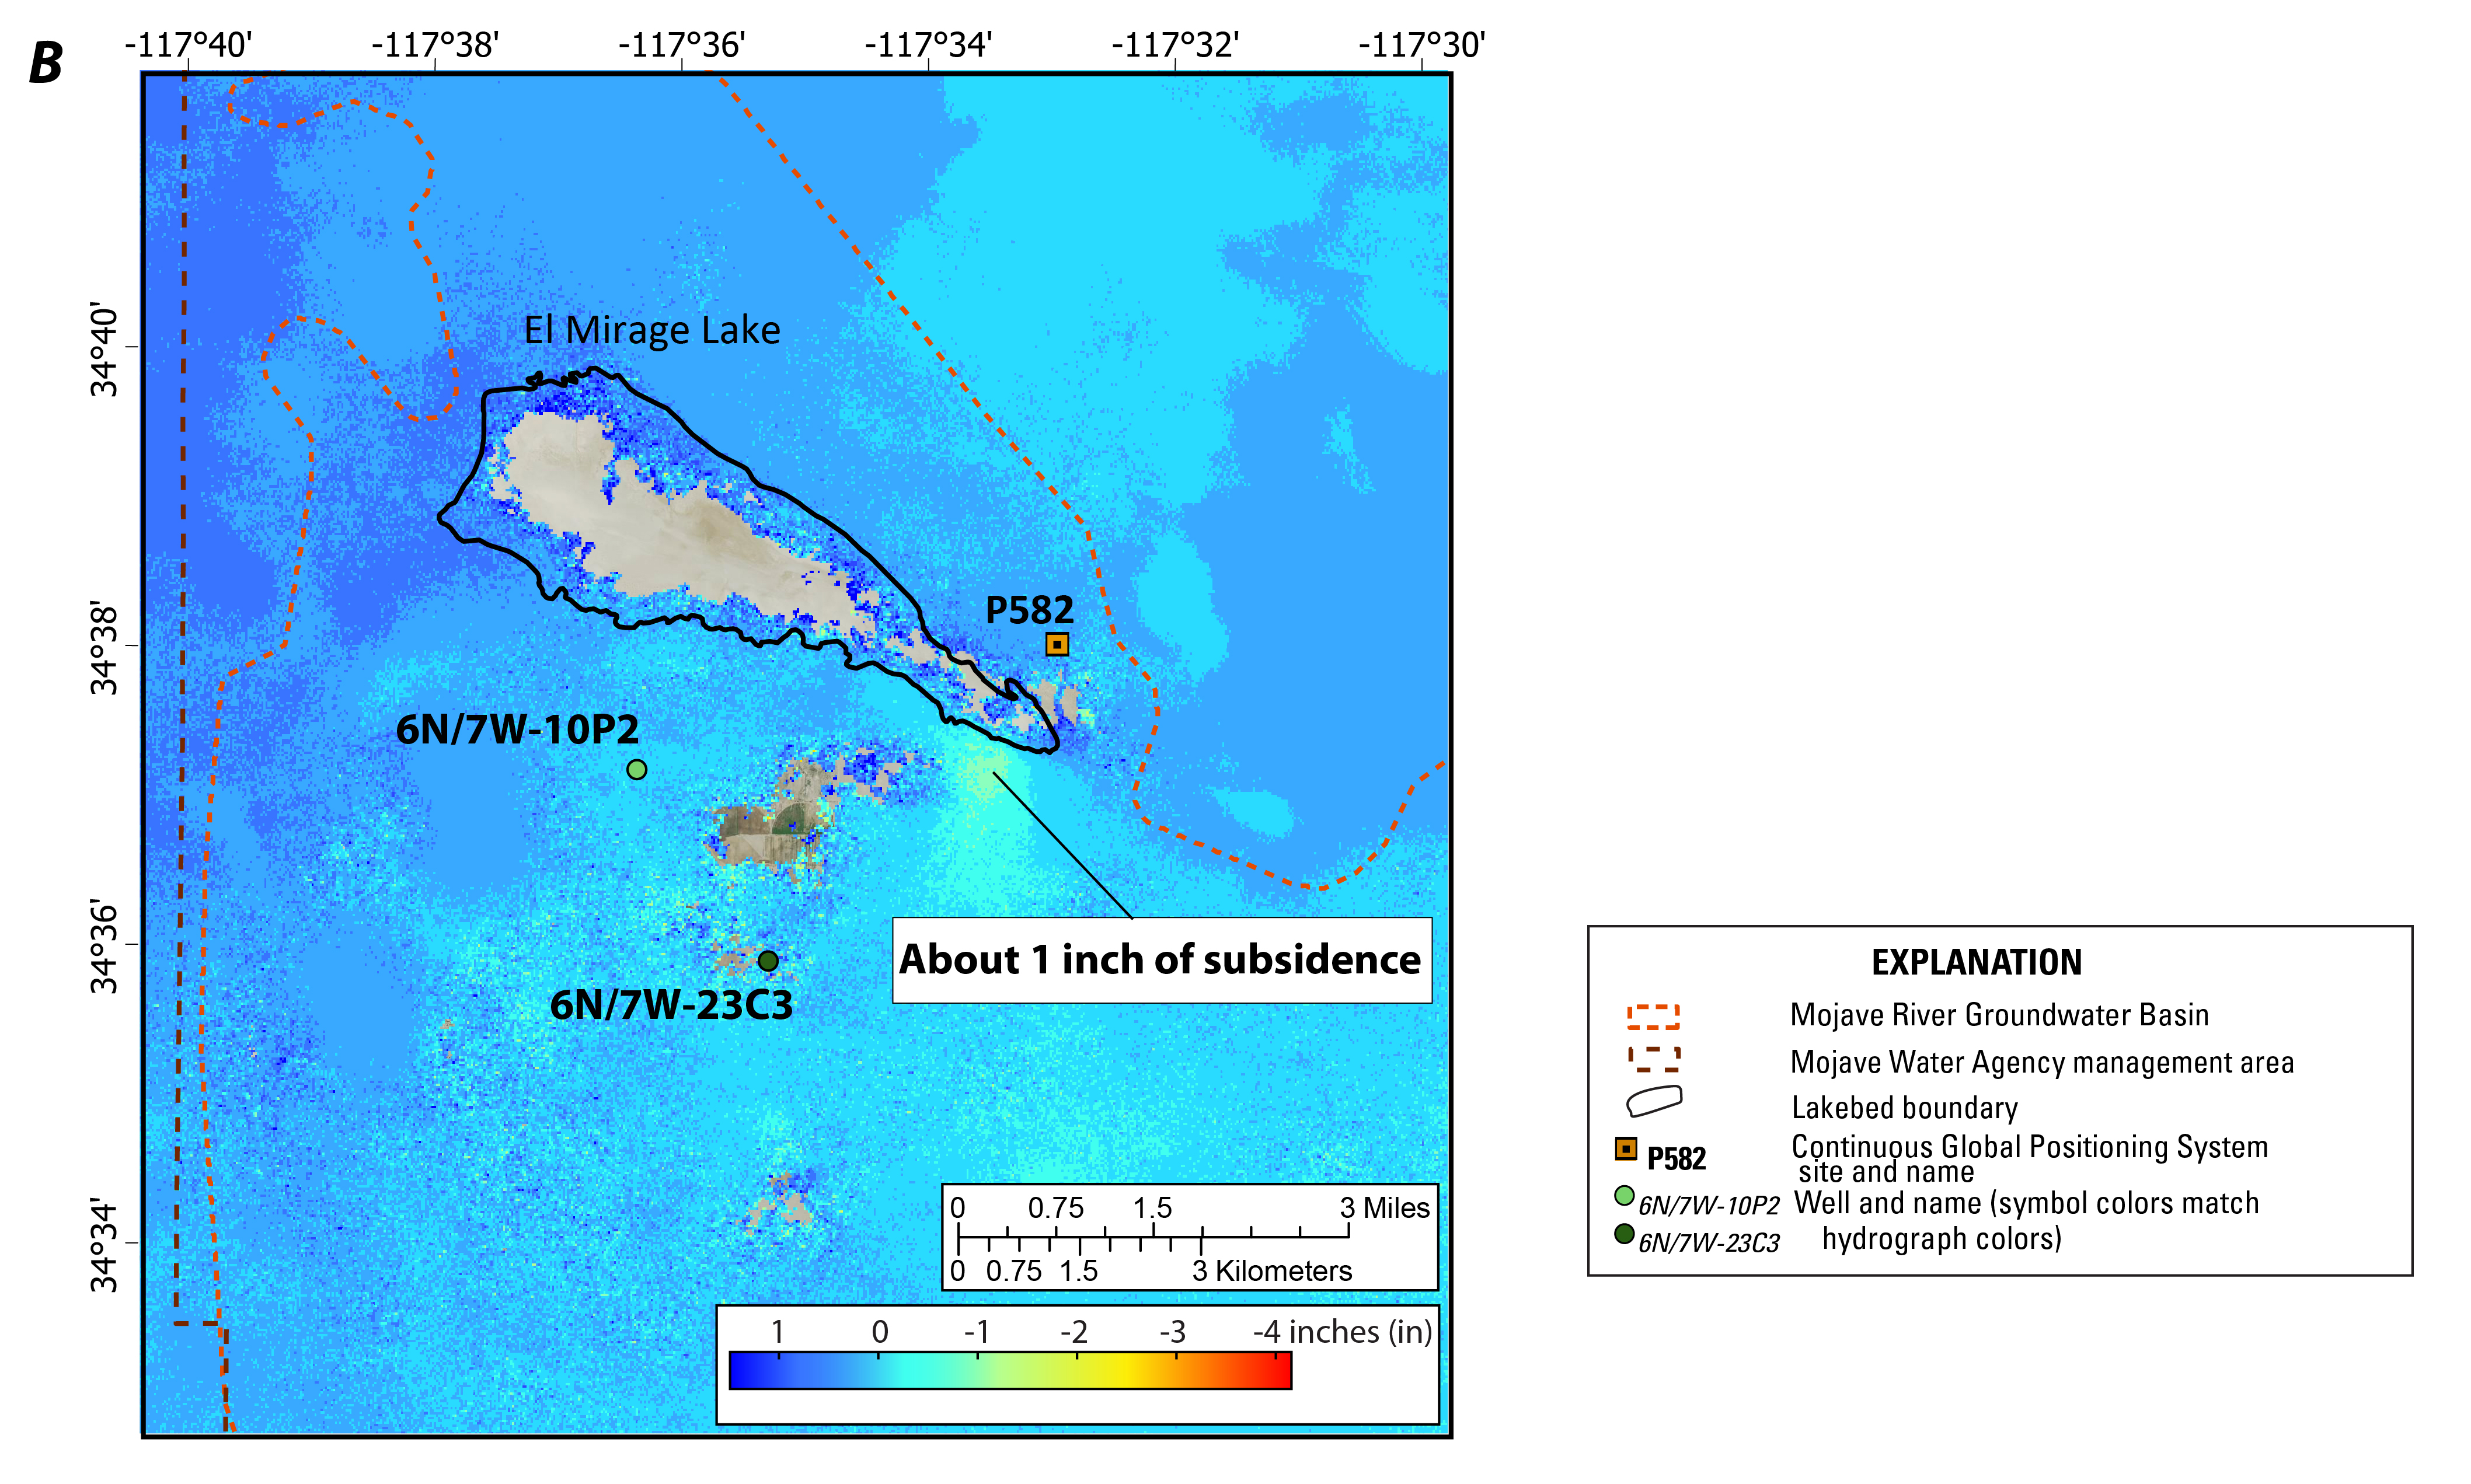
Figure 3: El Mirage subsidence area, southwestern Mojave Desert, California. A, Subsidence and water-level time series for 1992–2019; and B, Continuous Global Positioning System (CGPS) station P582 and selected wells on a composite interferogram depicting subsidence during December 2014–March 2019. Blank areas in interferogram were masked due to low pixel correlation. Groundwater-level data are available here. Base map is National Agriculture Imagery Program (NAIP) imagery from 2014.
Harper Lake
Observations
- About 1 in. of subsidence occurred during 2014–19, resulting in a total of about 9 in. of subsidence during 1992–2019 (fig. 4A).
- The average subsidence rate was about 0.25 in/yr during 2014–19, which is less than the about 0.40 in/yr rate during 1992–2009 (Brandt and Sneed, 2017).
- The extent of subsidence during 2014–19 (fig. 4B) was similar to the extent during 1992–2009 (Brandt and Sneed, 2017).
- Groundwater levels in shallower wells were stable or partly increased during 2014–19 (for example, 11N/3W-28R2); water levels in deeper wells increased slightly (for example, 10N/4W-10D1) during 2014–19 (fig. 4A).
- Clay layers ranging from 8 to 89 ft in thickness are present in the shallow and deep parts of the aquifer system near the subsiding area (Huff and others, 2002).
Discussion
- The compaction that occurred in the shallow and (or) deep parts of the aquifer system during 2014–19 likely was residual because groundwater levels were increasing when subsidence was measured.
- The reduced rate of subsidence during 2014–19 likely is partly related to the groundwater-level increases in the shallower part of the aquifer system, which contrasts the decline in groundwater levels observed from 1992 to 2009. The reduced subsidence rate also could be partly related to groundwater-level increases in the deeper part of the aquifer system during 2014–19. Groundwater-level increases can cause some parts of an aquifer system to expand, offsetting some of the continued compaction in other parts of an aquifer system.
- The 1 in. of subsidence that occurred during 2014–19 likely is at least partially permanent (inelastic); although the magnitude is small, it may be a result of steady drainage from thick clay layers.
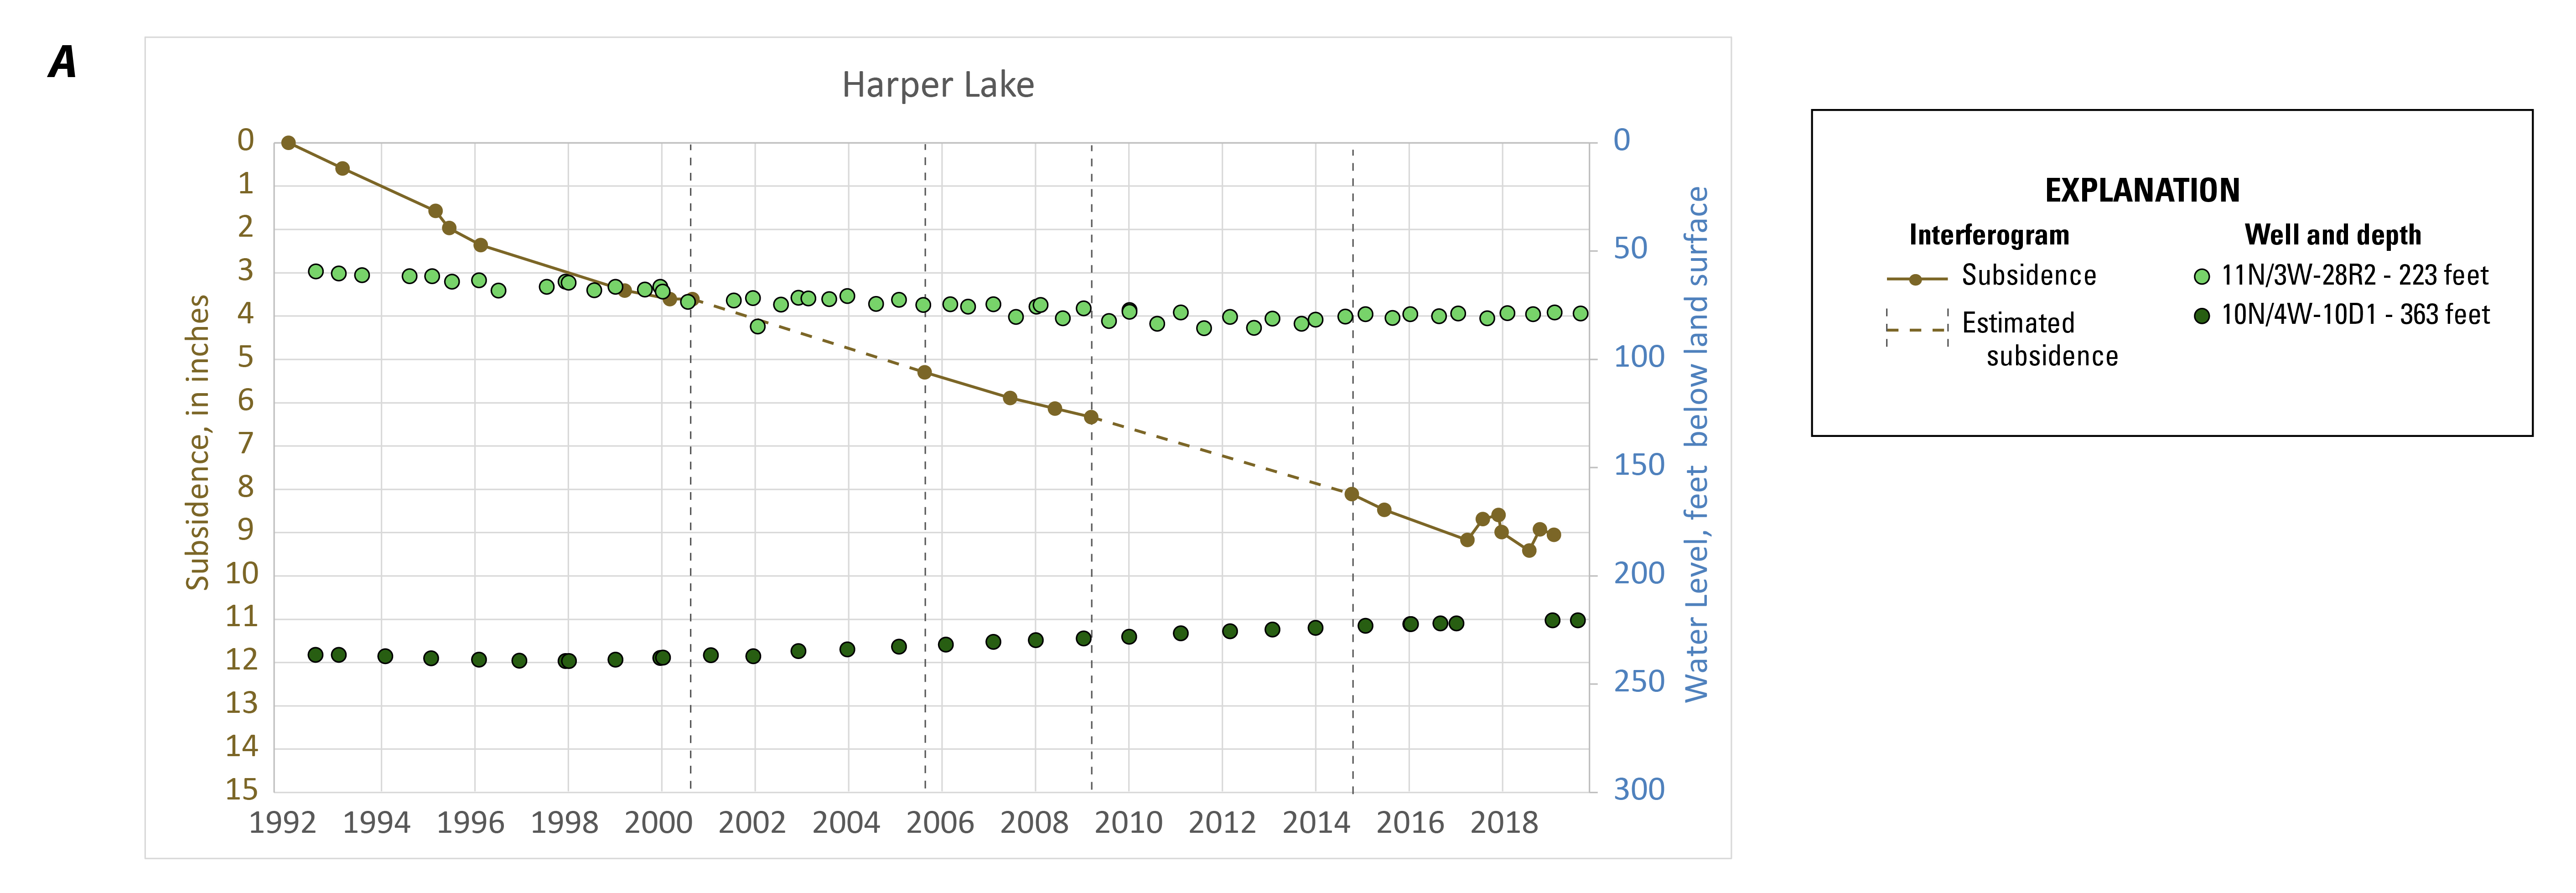
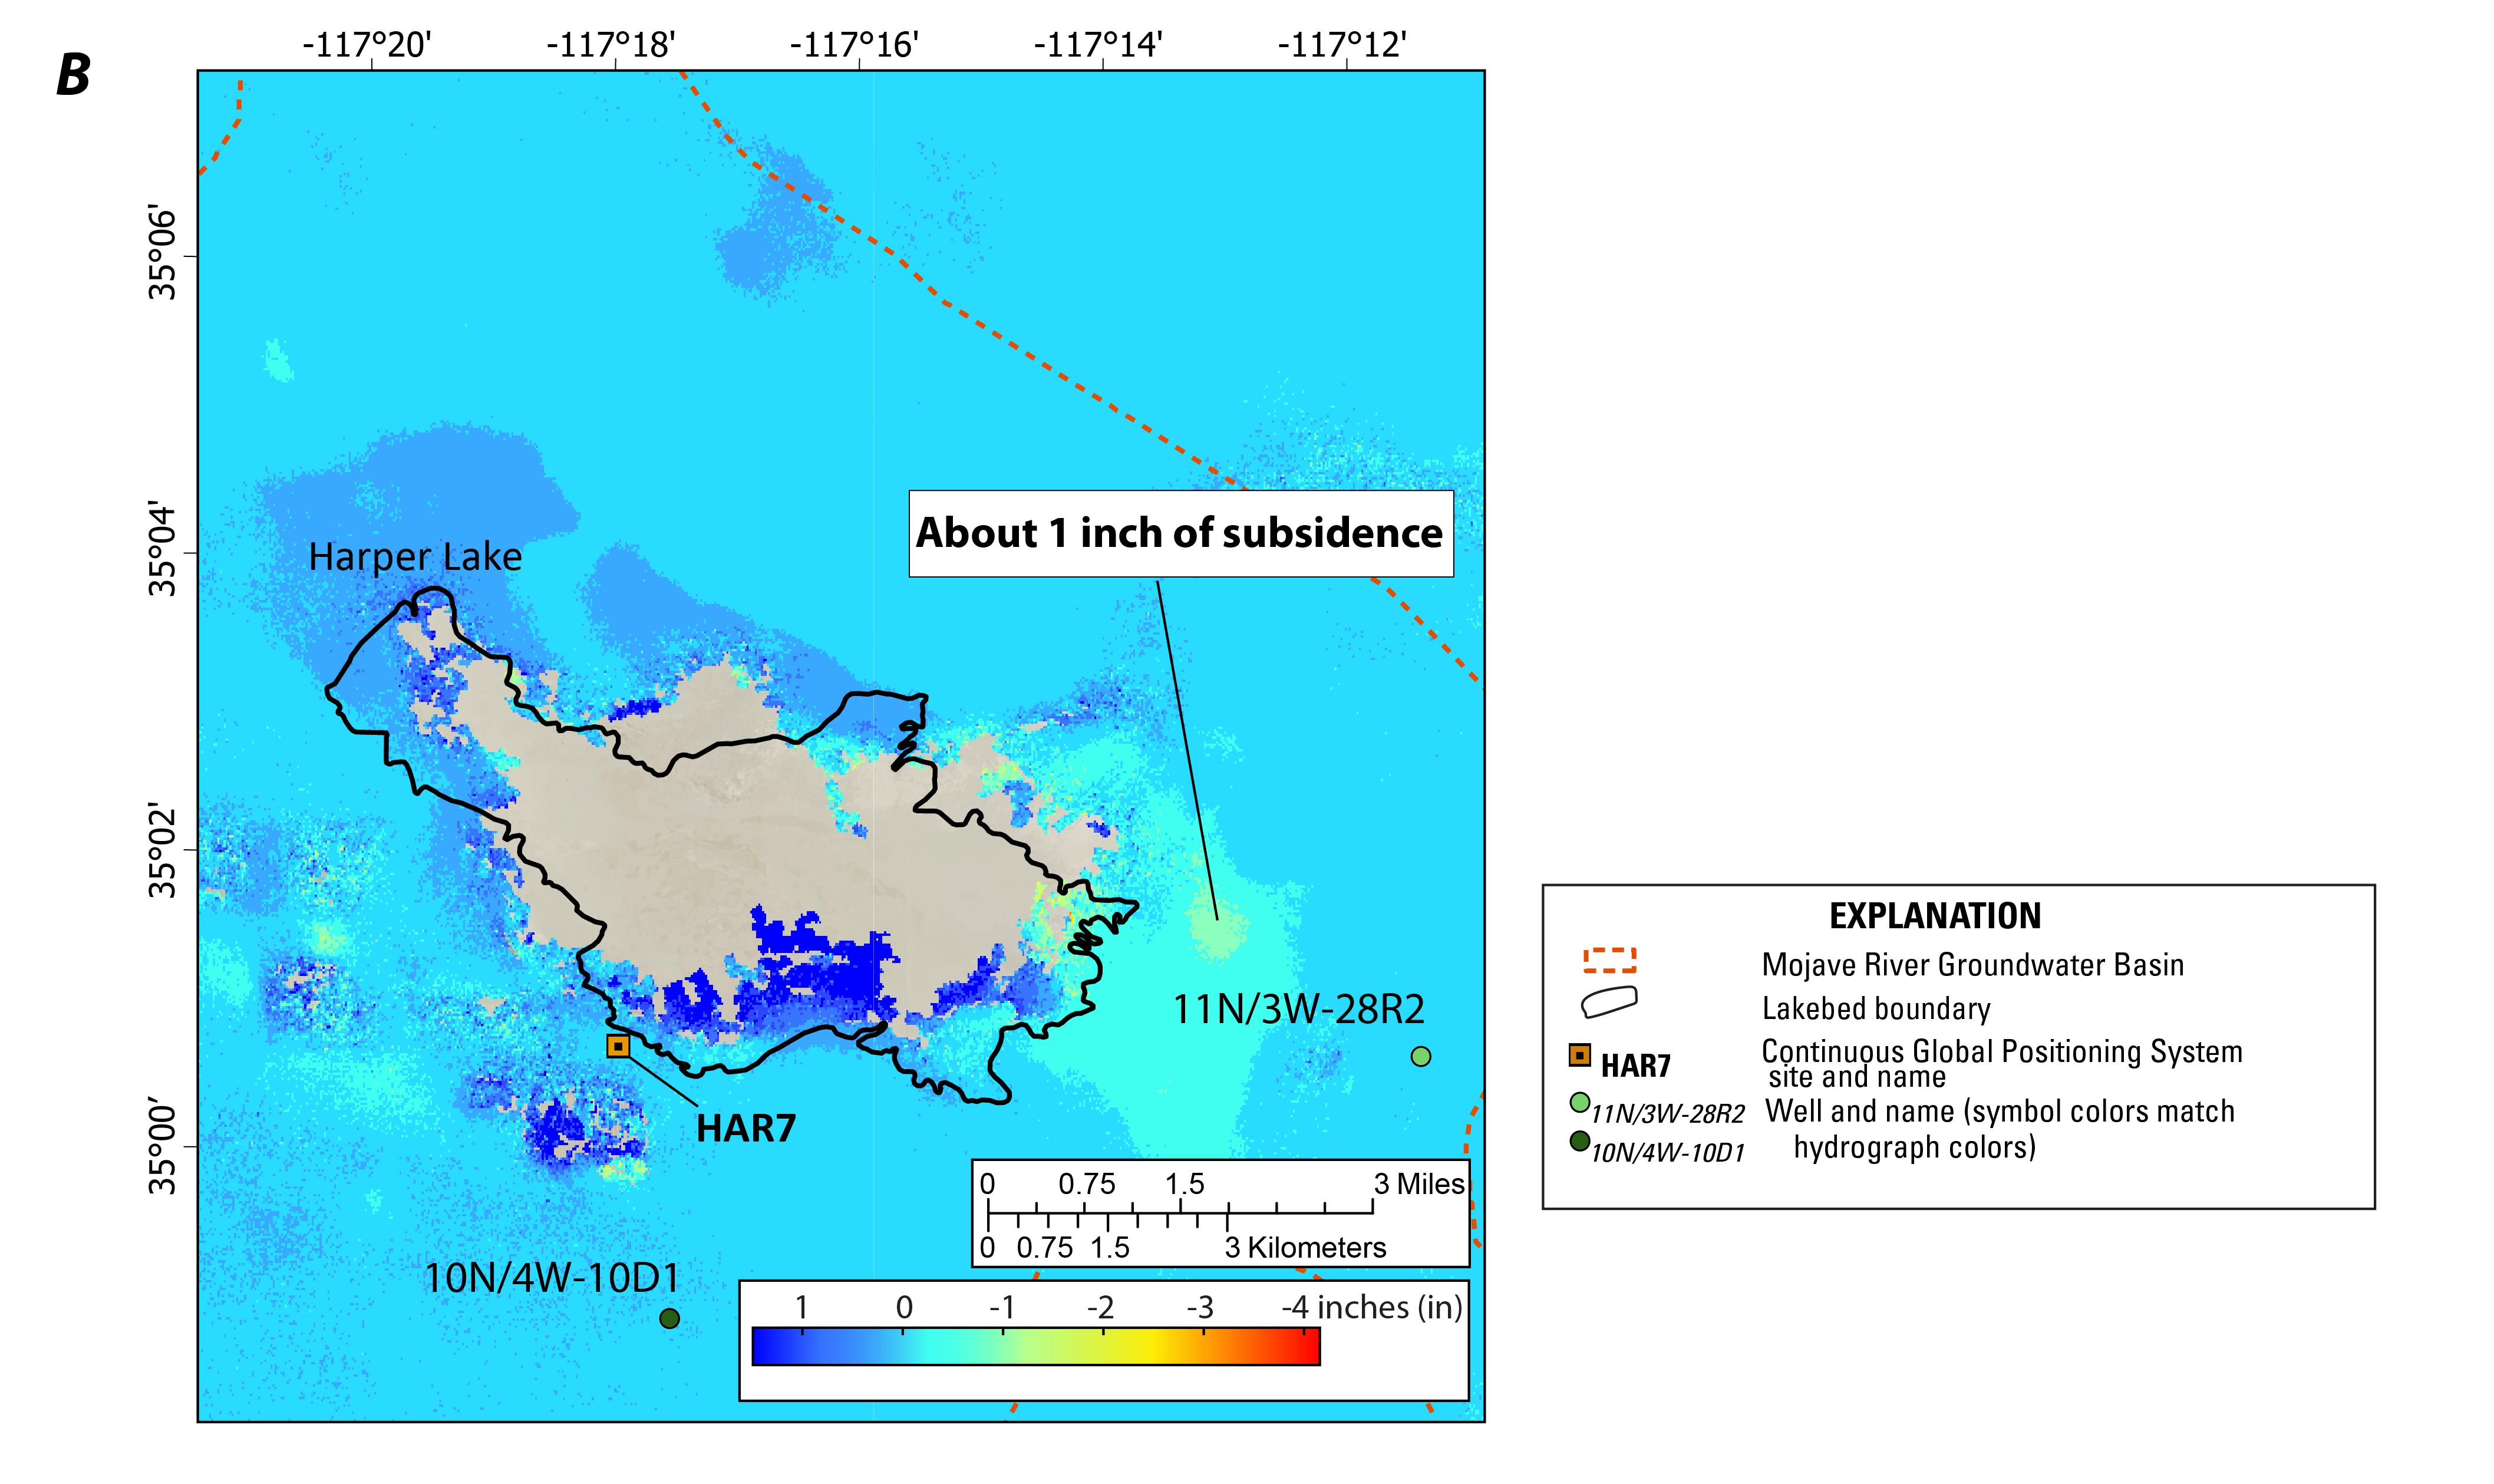
Figure 4: Harper Lake subsidence area, southwestern Mojave Desert, California. A, subsidence and groundwater-level time series for 1992–2019; and B, continuous Global Positioning System (CGPS) station HAR7 and selected wells on a composite interferogram depicting subsidence during December 2014–March 2019. Blank areas in interferogram were masked because of low pixel correlation. Groundwater-level data are available here. Base map is National Agriculture Imagery Program (NAIP) imagery from 2014.
Lucerne Lake
Observations
- About 1 in. of subsidence occurred during 2014–19, resulting in a total of about 14 in. of subsidence during 1992–2019 (fig. 5A).
- The average subsidence rate was about 0.25 in/yr during 2014–19, which is less than half of the 0.60 in/yr rate during 1992–2009 (Brandt and Sneed, 2017).
- The extent of subsidence during 2014–19 (fig. 5B) was similar to the extent during 1992–2009 (Brandt and Sneed, 2017). However, the location of maximum subsidence during 1992–2009 (location A in figure 5B) was about 1.5 miles (mi) south of the location of maximum subsidence during 2014–19 (location B in figure 5B) and the magnitude was about 4 in. (or about 1 in/yr).
- Groundwater levels in some shallower wells were quite stable during 2014–19 (for example, 4N/1W-1R9); water levels in deeper wells generally fluctuated seasonally and increased (for example, 5N/1W-36F1) during 2014–19 (fig. 5A).
- Clay layers ranging from 20 to 40 ft in thickness are present in shallower parts of the aquifer system, but clay was not detected at depth near the subsiding area (Huff and others, 2002).
- Fissures have been observed on, and southeast of, Lucerne Lake (Sneed and others, 2003; fig. 5B). These fissures have caused damage to State Route 247 (fig. 5C).
Discussion
- The compaction that occurred in the shallower part of the aquifer system during 2014–19 likely was residual because groundwater levels generally were stable when subsidence was measured during this period, and thick, loosely compacted clay layers are present.
- The reduced rate of subsidence during 2014–19 likely is partly related to the groundwater-level stability in the shallow part of the system, which contrasts the groundwater-level declines observed from 1997–2009. The reduced subsidence rate also could be partly related to groundwater-level increases in the deeper part of the aquifer system during 2014–19. Groundwater-level increases cause susceptible parts of an aquifer system to expand, offsetting some of the continued compaction in other parts of an aquifer system.
- The 4 in. of subsidence that occurred at location B in figure 5B during 2014–19 likely was at least partially permanent (inelastic) and may be a result of steady drainage from the thick clay layers.
- The fissures likely were caused by localized differential subsidence, where more subsidence occurred to the southeast of the fissures than to the northwest.
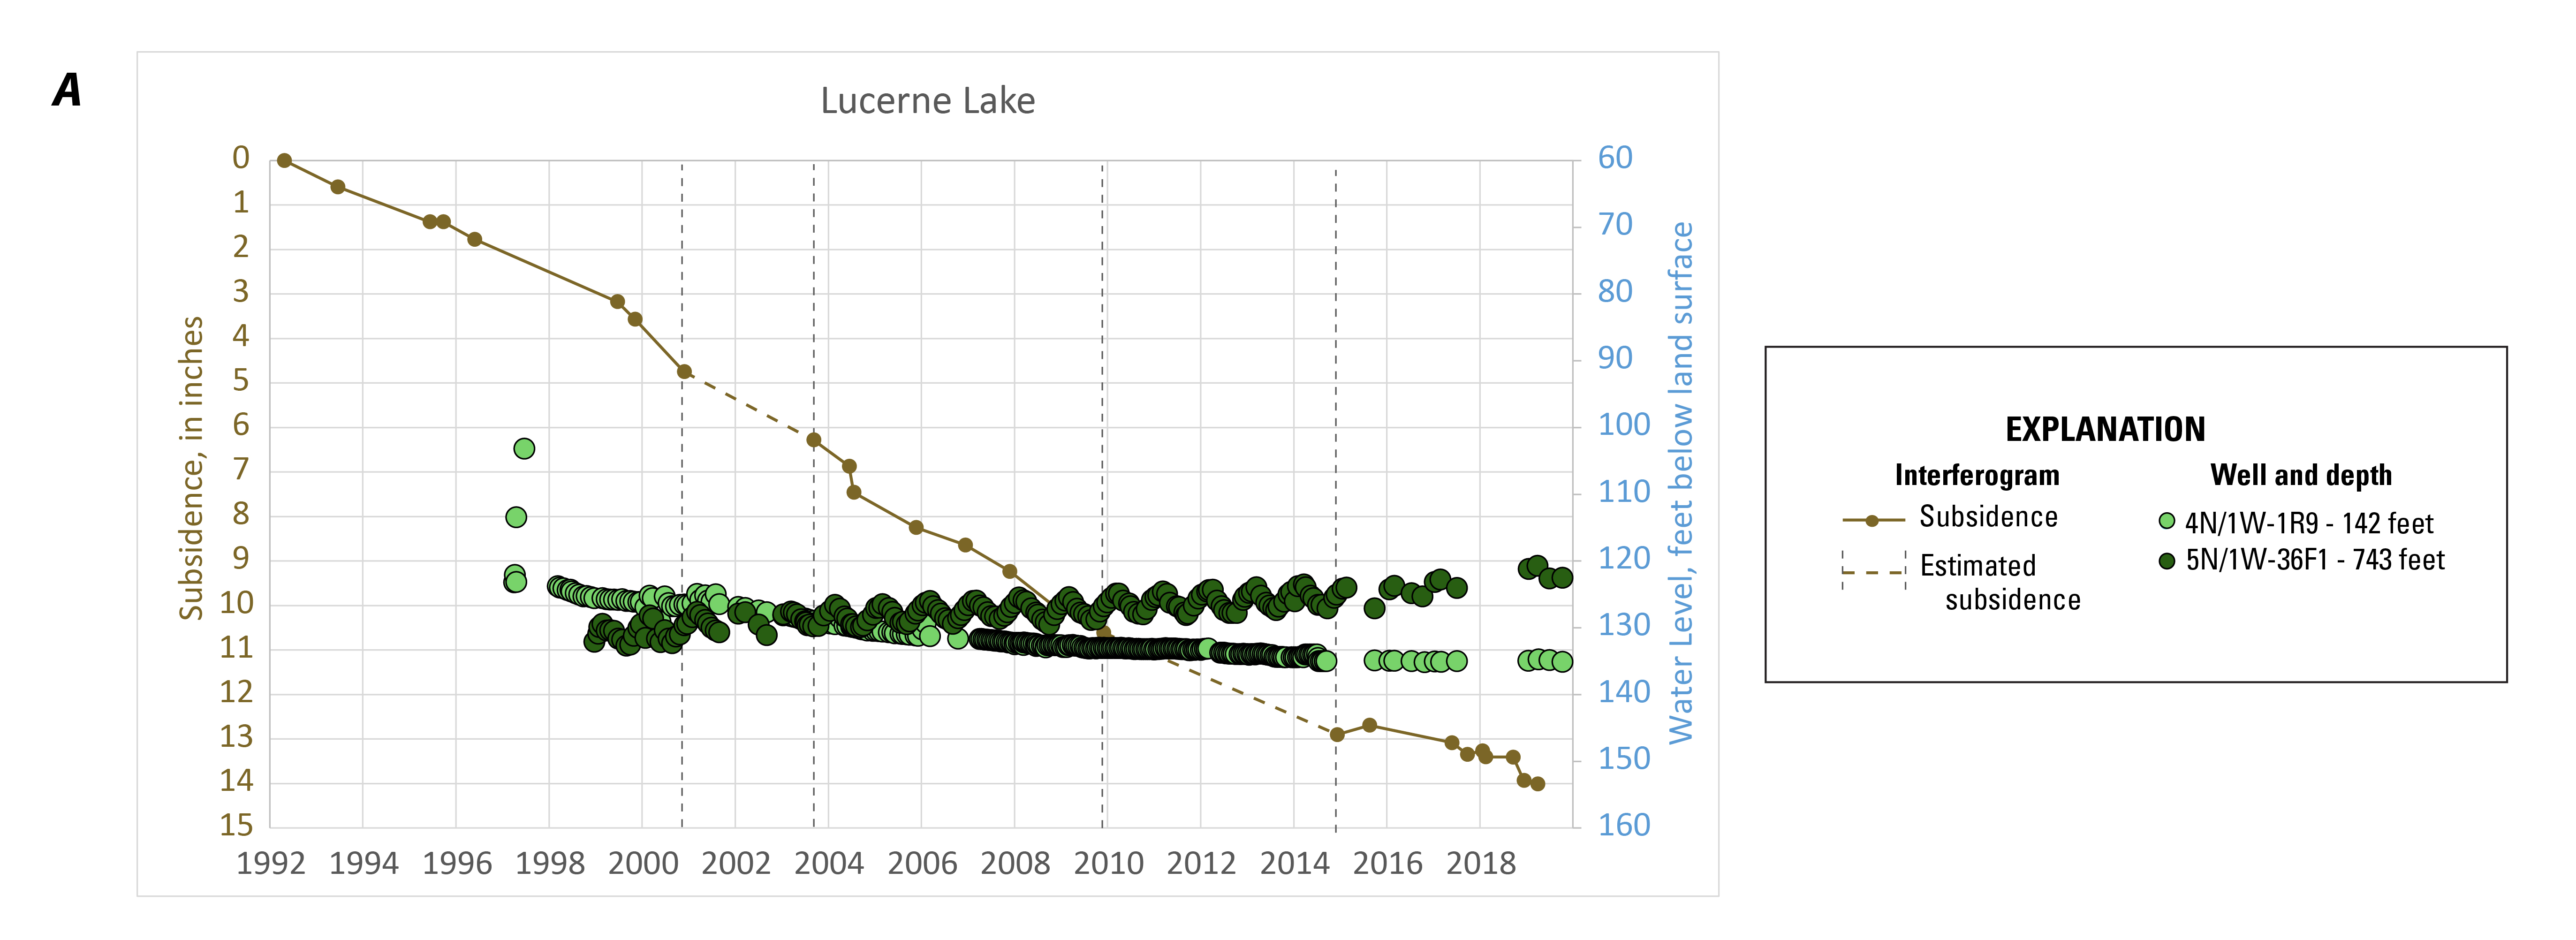
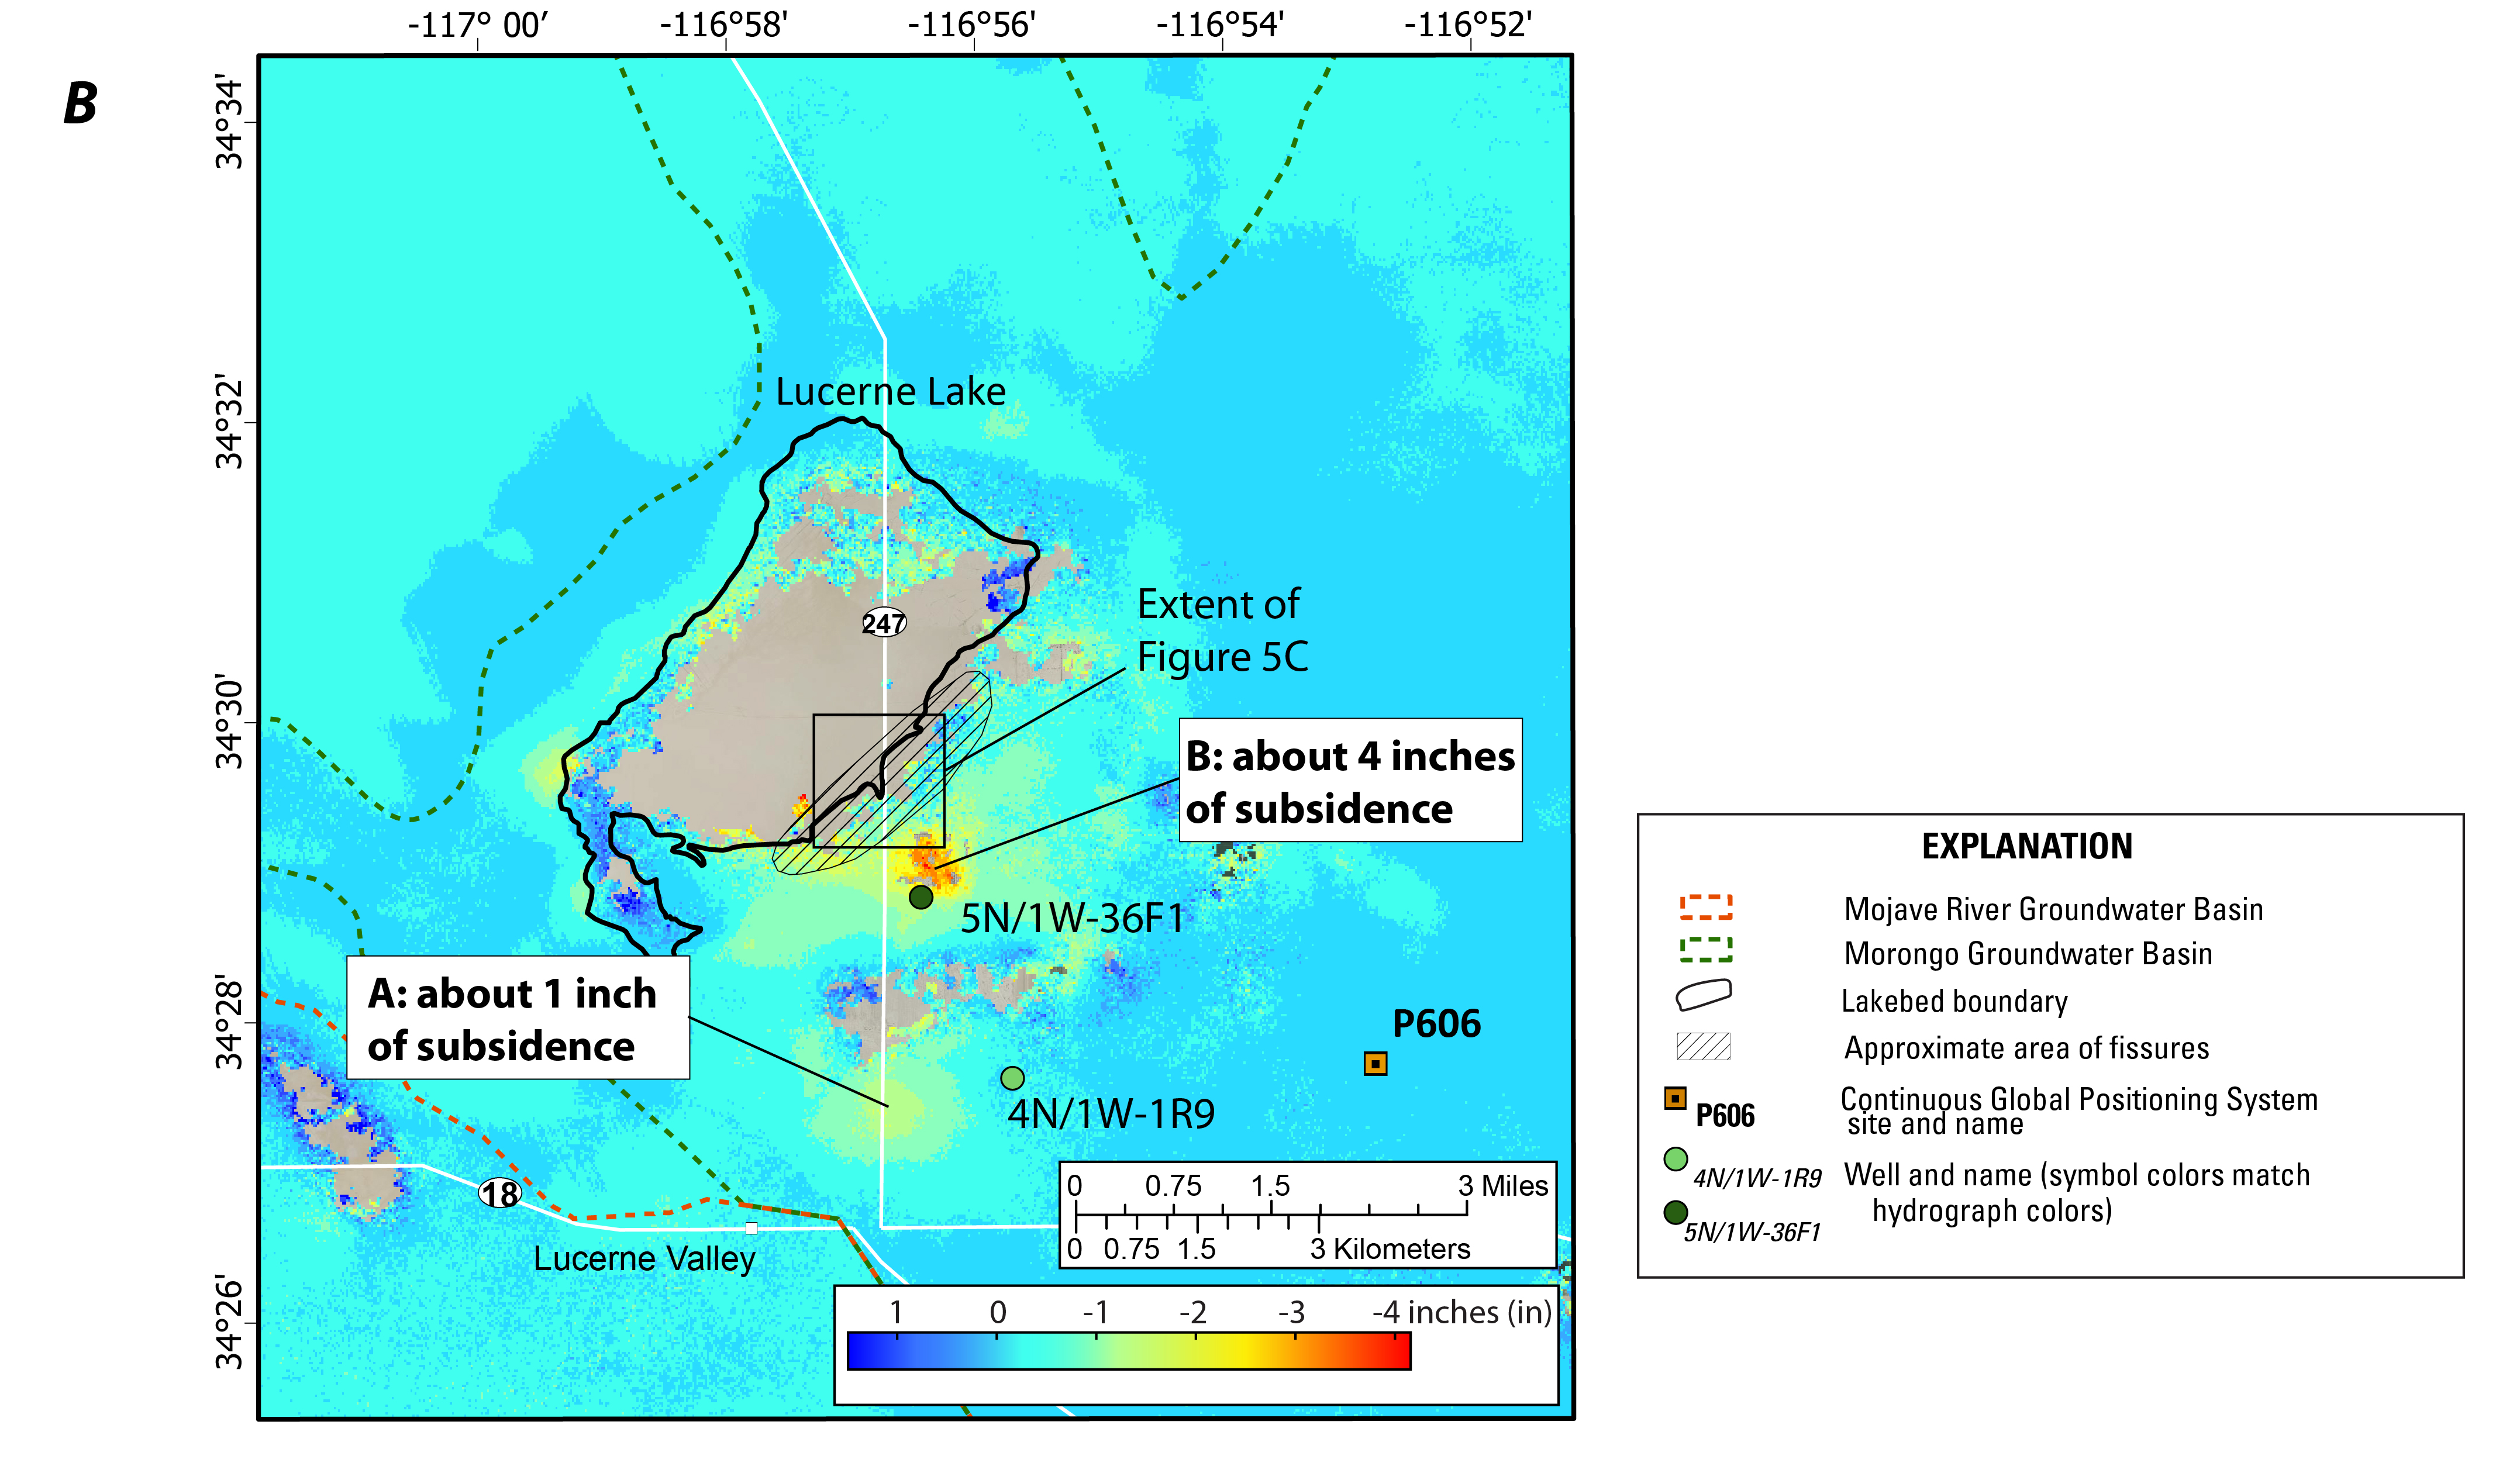
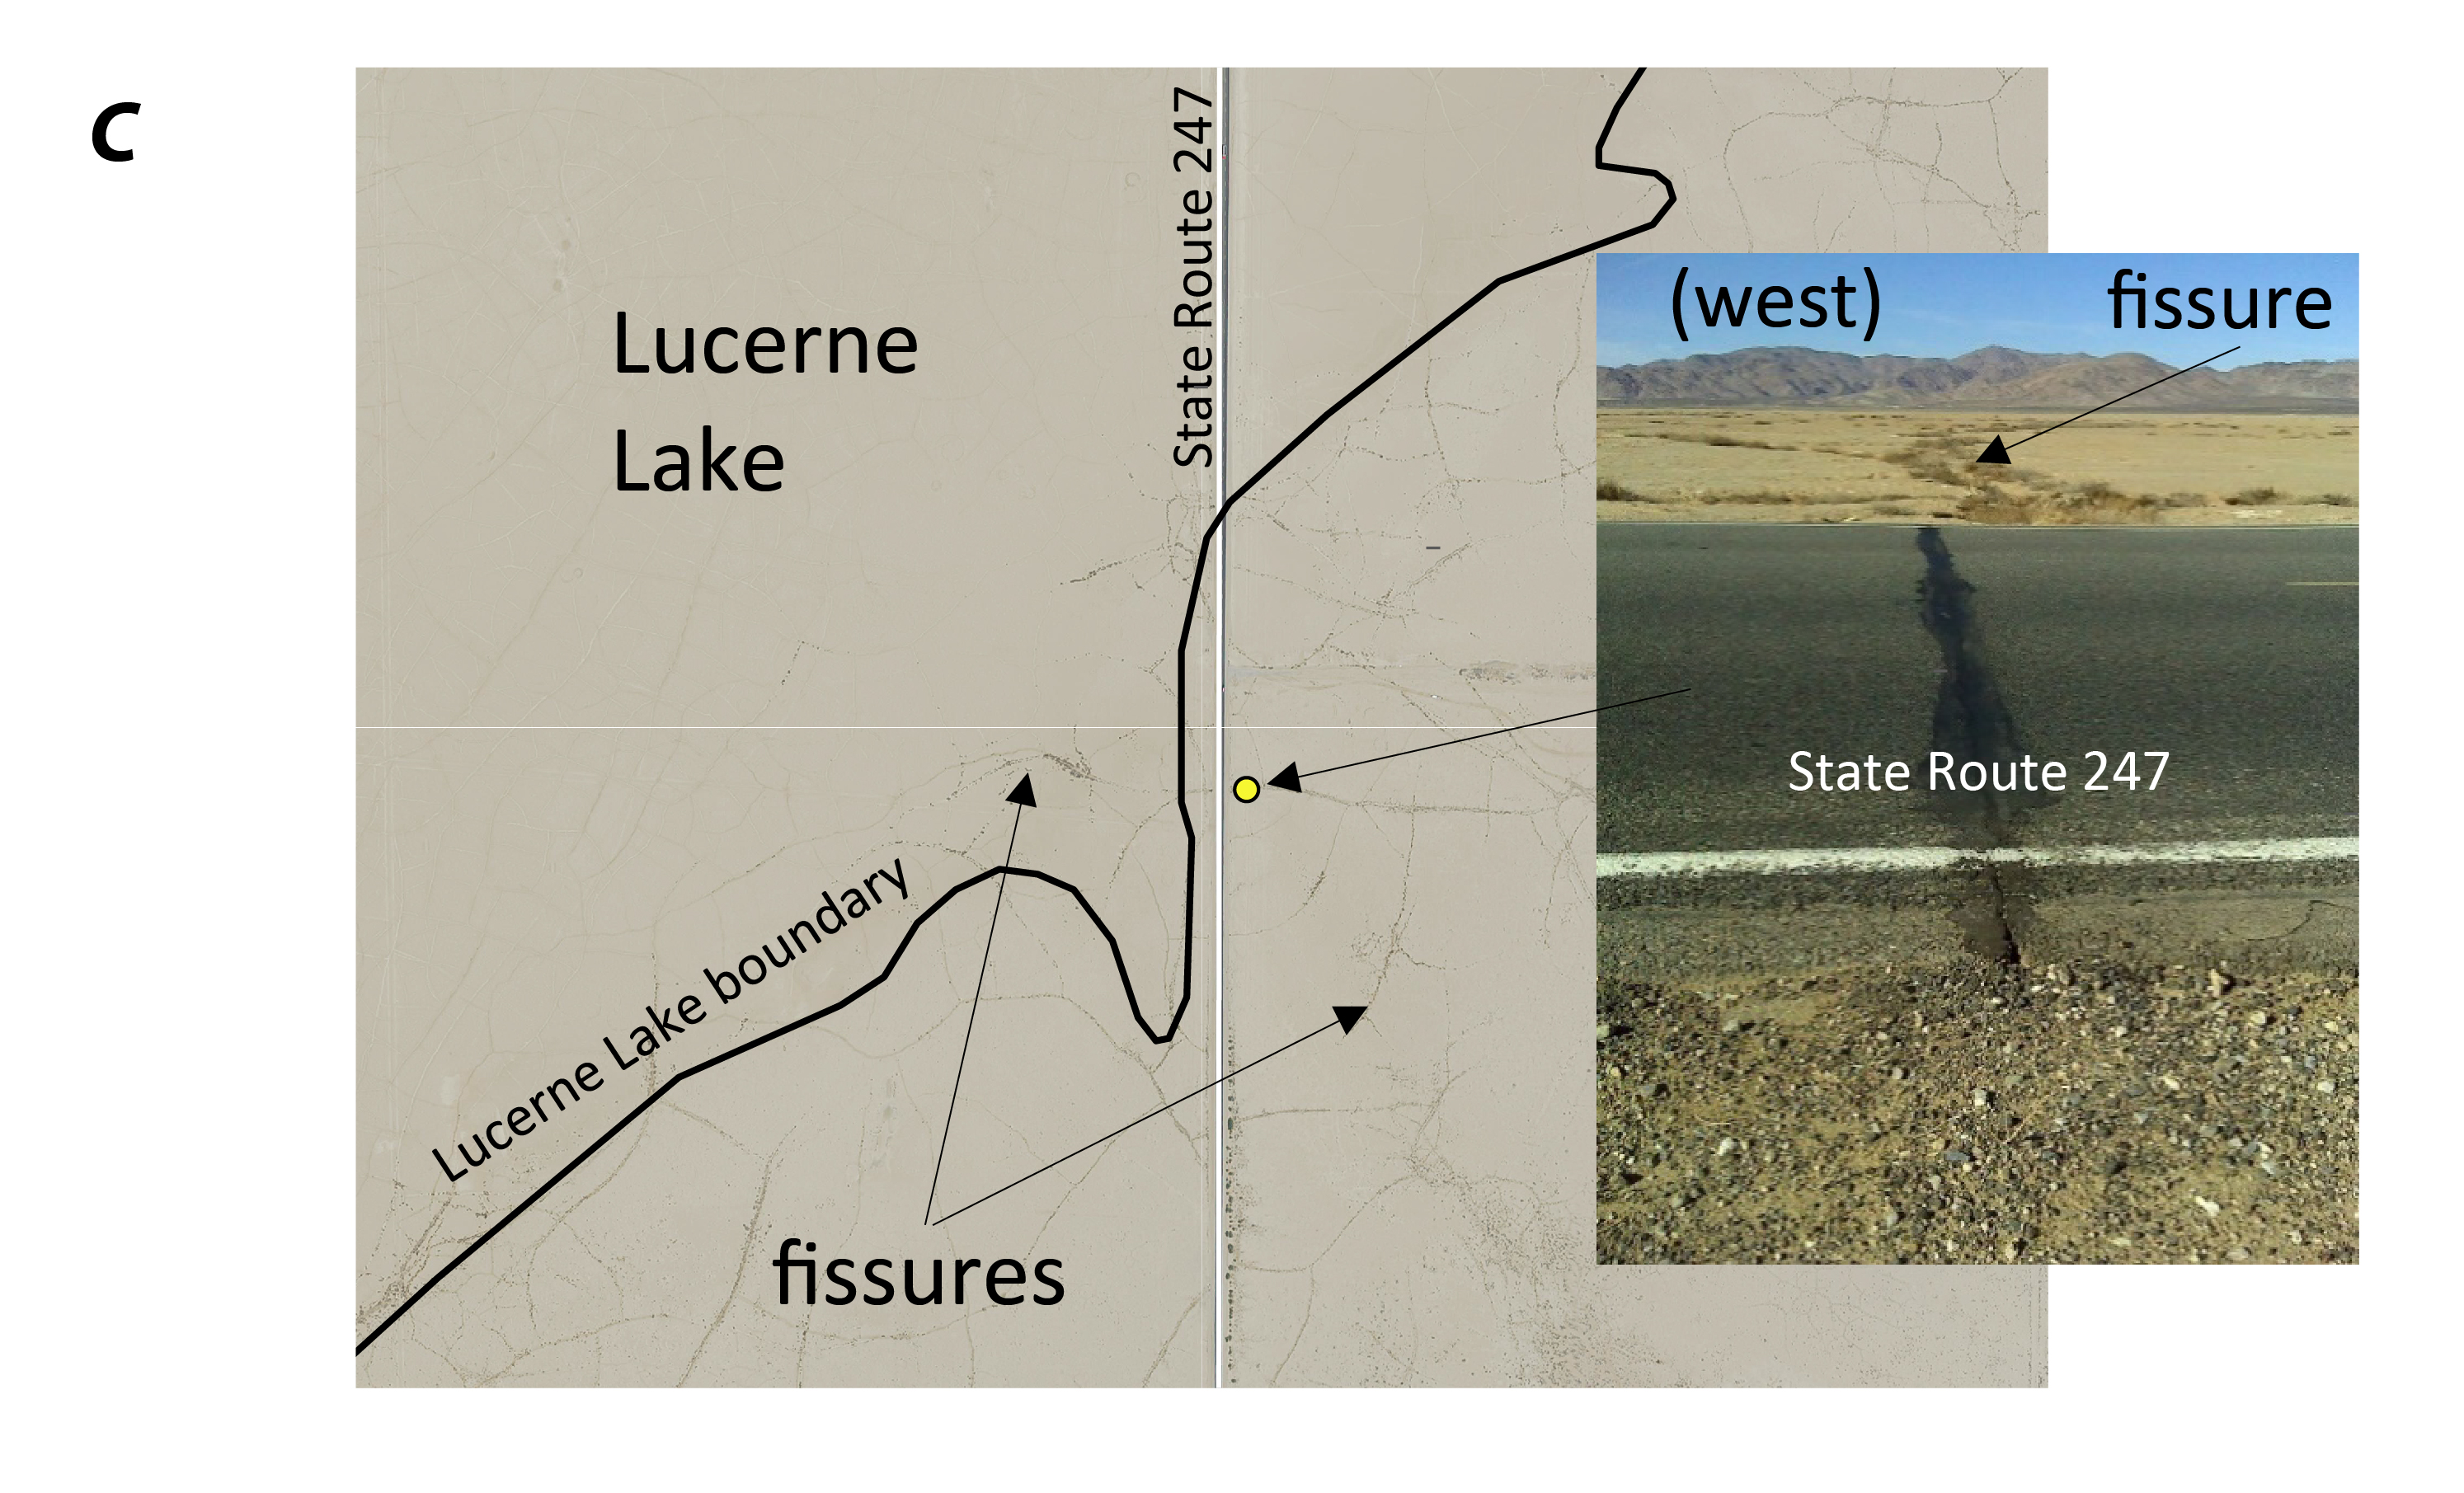
Figure 5: Lucerne Lake subsidence area, southwestern Mojave Desert, California. A, subsidence and groundwater-level time series for 1992–2019 at location A; B, continuous Global Positioning System (CGPS) station P606 and selected wells on a composite interferogram depicting subsidence during December 2014–March 2019; and C, areal imagery showing locations of fissures on, and southeast of, the lake bed and photo of repairs to State Route 247 after fissures damaged the road surface. Photograph by Michelle Sneed, U.S. Geological Survey (January 2018). Blank areas in interferogram were masked because of low pixel correlation. Groundwater-level data are available here. Base map is National Agriculture Imagery Program (NAIP) imagery from 2014.
Coyote Lake
Observations
- About 2 in. of subsidence occurred during 2014–19, resulting in a total of about 6 in. of subsidence during 2004–19 (fig. 6A). Subsidence was not detected during 1992–2004 (Brandt and Sneed, 2017).
- The average subsidence rate was about 0.40 in/yr during 2014–19, which is about the same rate during 2004–09 (Brandt and Sneed, 2017).
- The extent of subsidence during 2014–19 (fig. 6B) was similar to the extent during 2004–09 (Brandt and Sneed, 2017).
- Groundwater levels in nearby wells declined less than 1 ft to historically low levels (for example, 12N/1E-35A1; and 12N/2E-19K1) during 2014–19 (fig. 6A).
- Clay thickness is not known (Solt and Sneed, 2014) .
Discussion
- Sparse lithological data hindered interpretations regarding the depths, timing, and permanence of compaction.
- The groundwater-level declines in wells (most of unknown depths) of less than 1 ft suggest that groundwater-level declines in other parts of the aquifer system may have contributed to the subsidence.
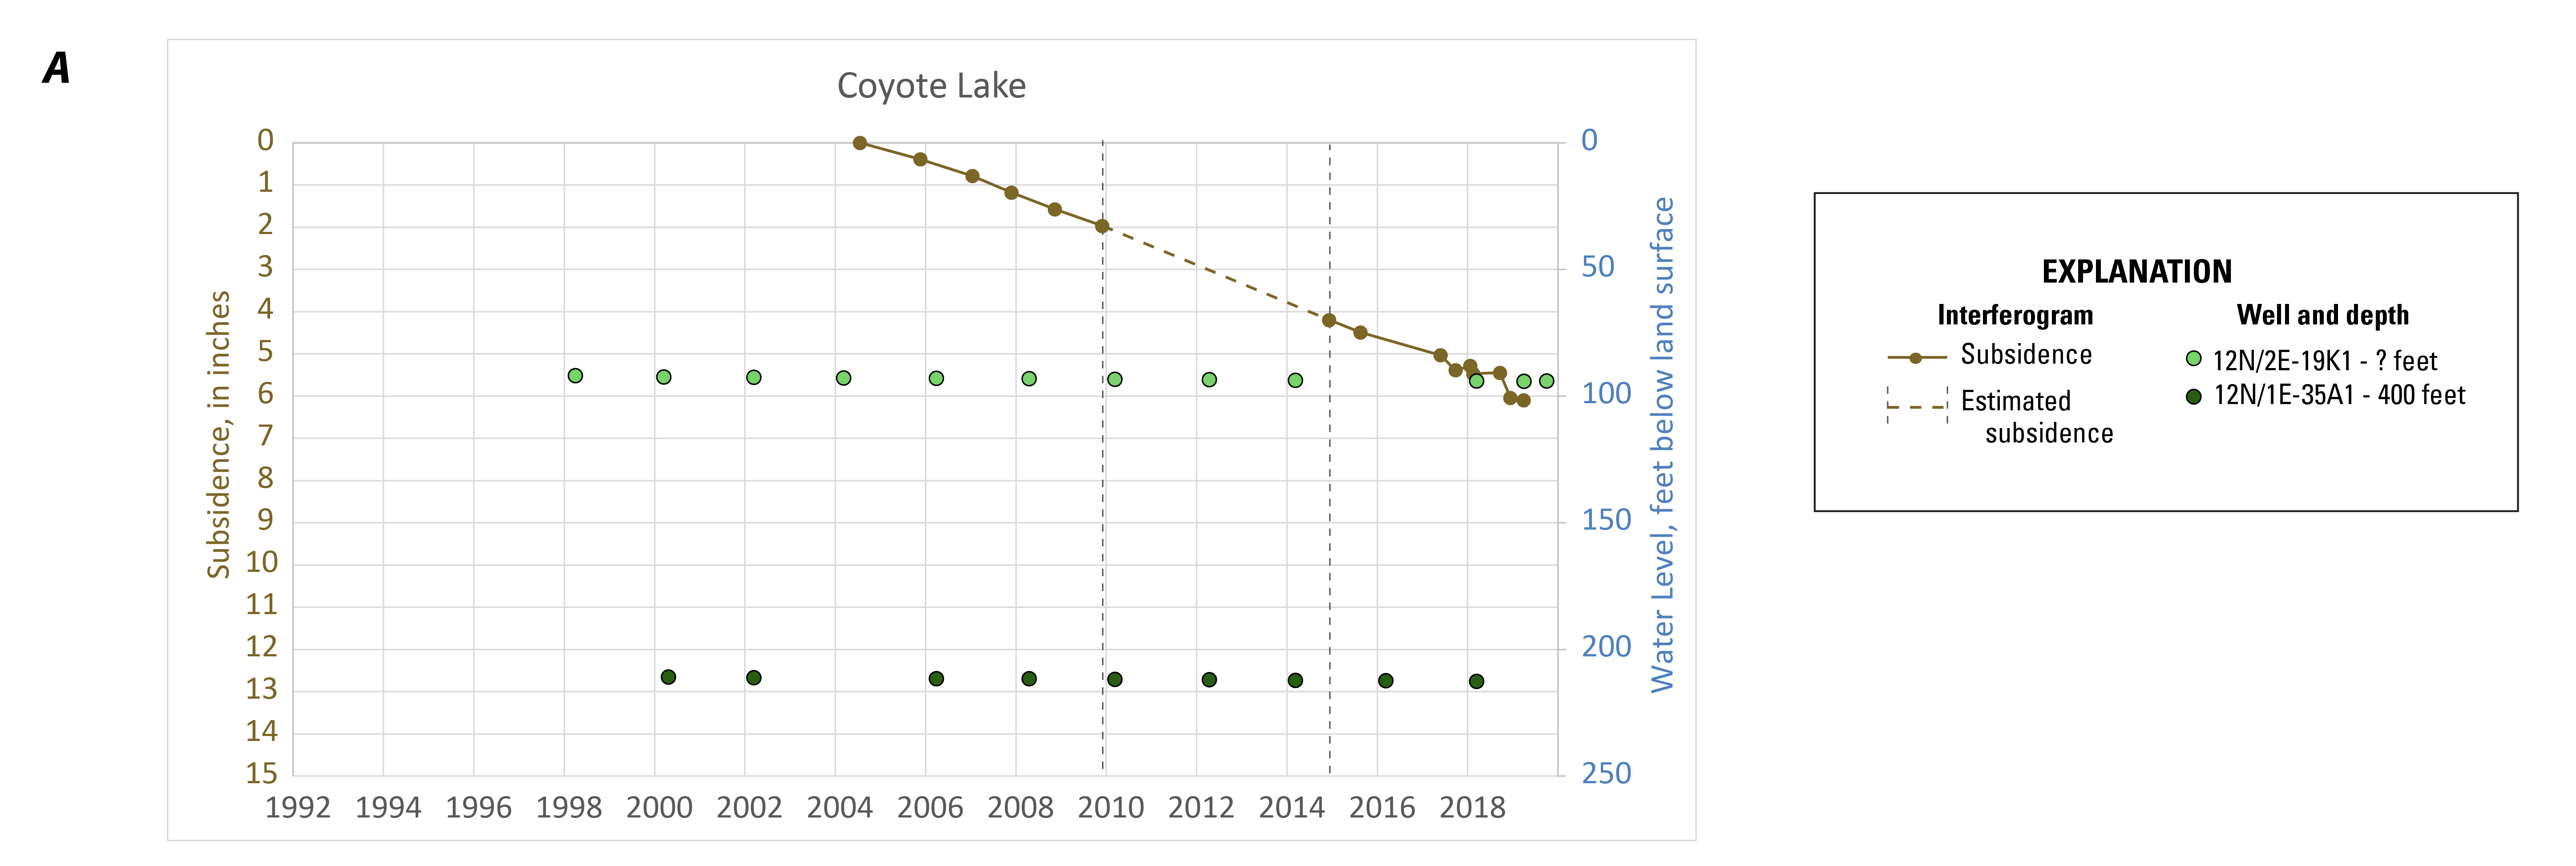
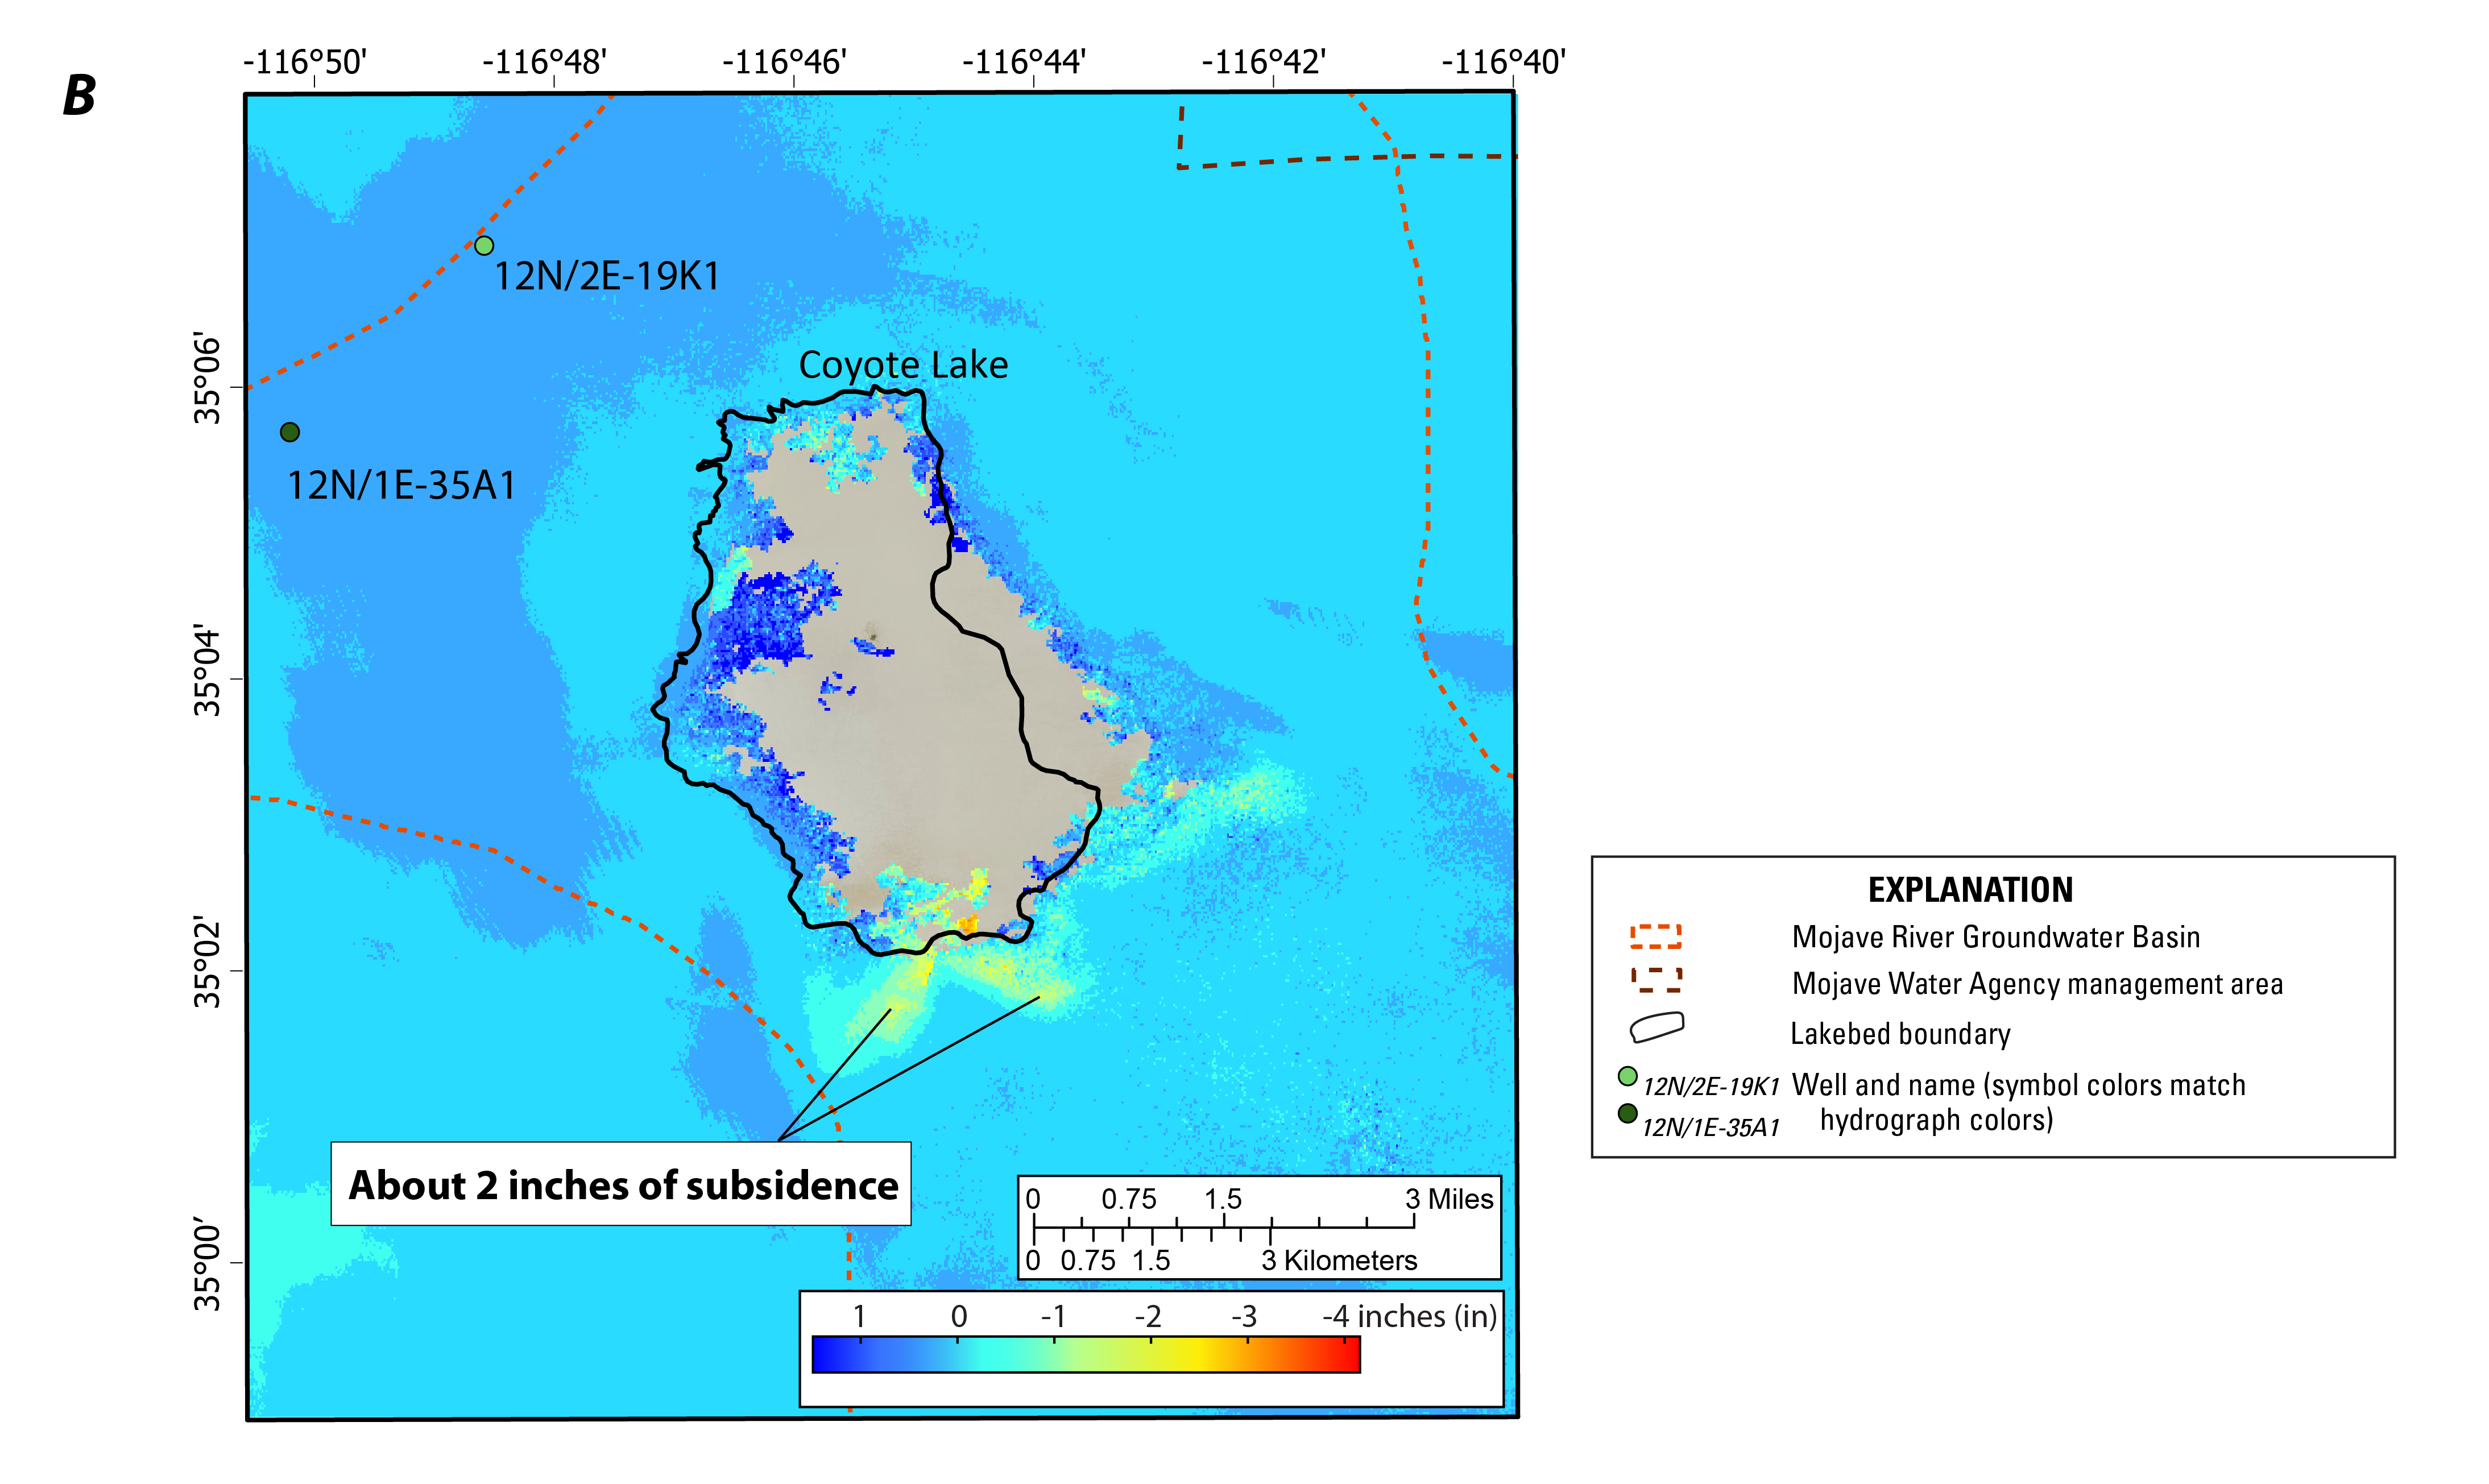
Figure 6: Coyote Lake subsidence area, southwestern Mojave Desert, California. A, Subsidence and water-level time series for 1998–2019; and B, Selected wells on a composite interferogram depicting subsidence during December 2014–March 2019. Blank areas in interferogram were masked due to low pixel correlation. Groundwater-level data are available here. Base map is National Agriculture Imagery Program (NAIP) imagery from 2014.
Troy Lake
Observations
- About 2.5 in. of subsidence occurred during 2014–19, resulting in a total of about 11 in. of subsidence during 1993–2019 (fig. 7A).
- The average subsidence rate was about 0.60 in/yr during 2014–19, which is larger than the 0.45 in/yr rate during 2004–09 and the 0.15 in/yr rate during 1993–99 (Brandt and Sneed, 2017).
- The extent of subsidence during 2014–19 (fig. 7B) was similar to the extent during 1993–2009 (Brandt and Sneed, 2017).
- Groundwater levels in some wells declined during 1992–2019, reaching historically low levels (for example, 9N/2E-12F4 and 9N/3E-22R5) during 2014–19 (fig. 7A).
- Clay layers ranging from 3 to 100 ft in thickness are present in the shallow and deep parts of the aquifer system near the subsiding area (Huff and others, 2002).
Discussion
- The compaction that occurred throughout the aquifer system during 2014–19 likely was both concurrent and residual because groundwater levels were declining during and prior to this period, and thin and thick clay layers are present throughout the aquifer system.
- The increased rate of subsidence may be related to the exceedance of preconsolidation stresses caused by historically low water levels in some parts of the aquifer system.
- The 2.5 in. of subsidence that occurred during 2014–19 likely was at least partially permanent (inelastic); it may partly be a result of steady drainage from thick clays augmented with concurrent compaction from thinner clays.
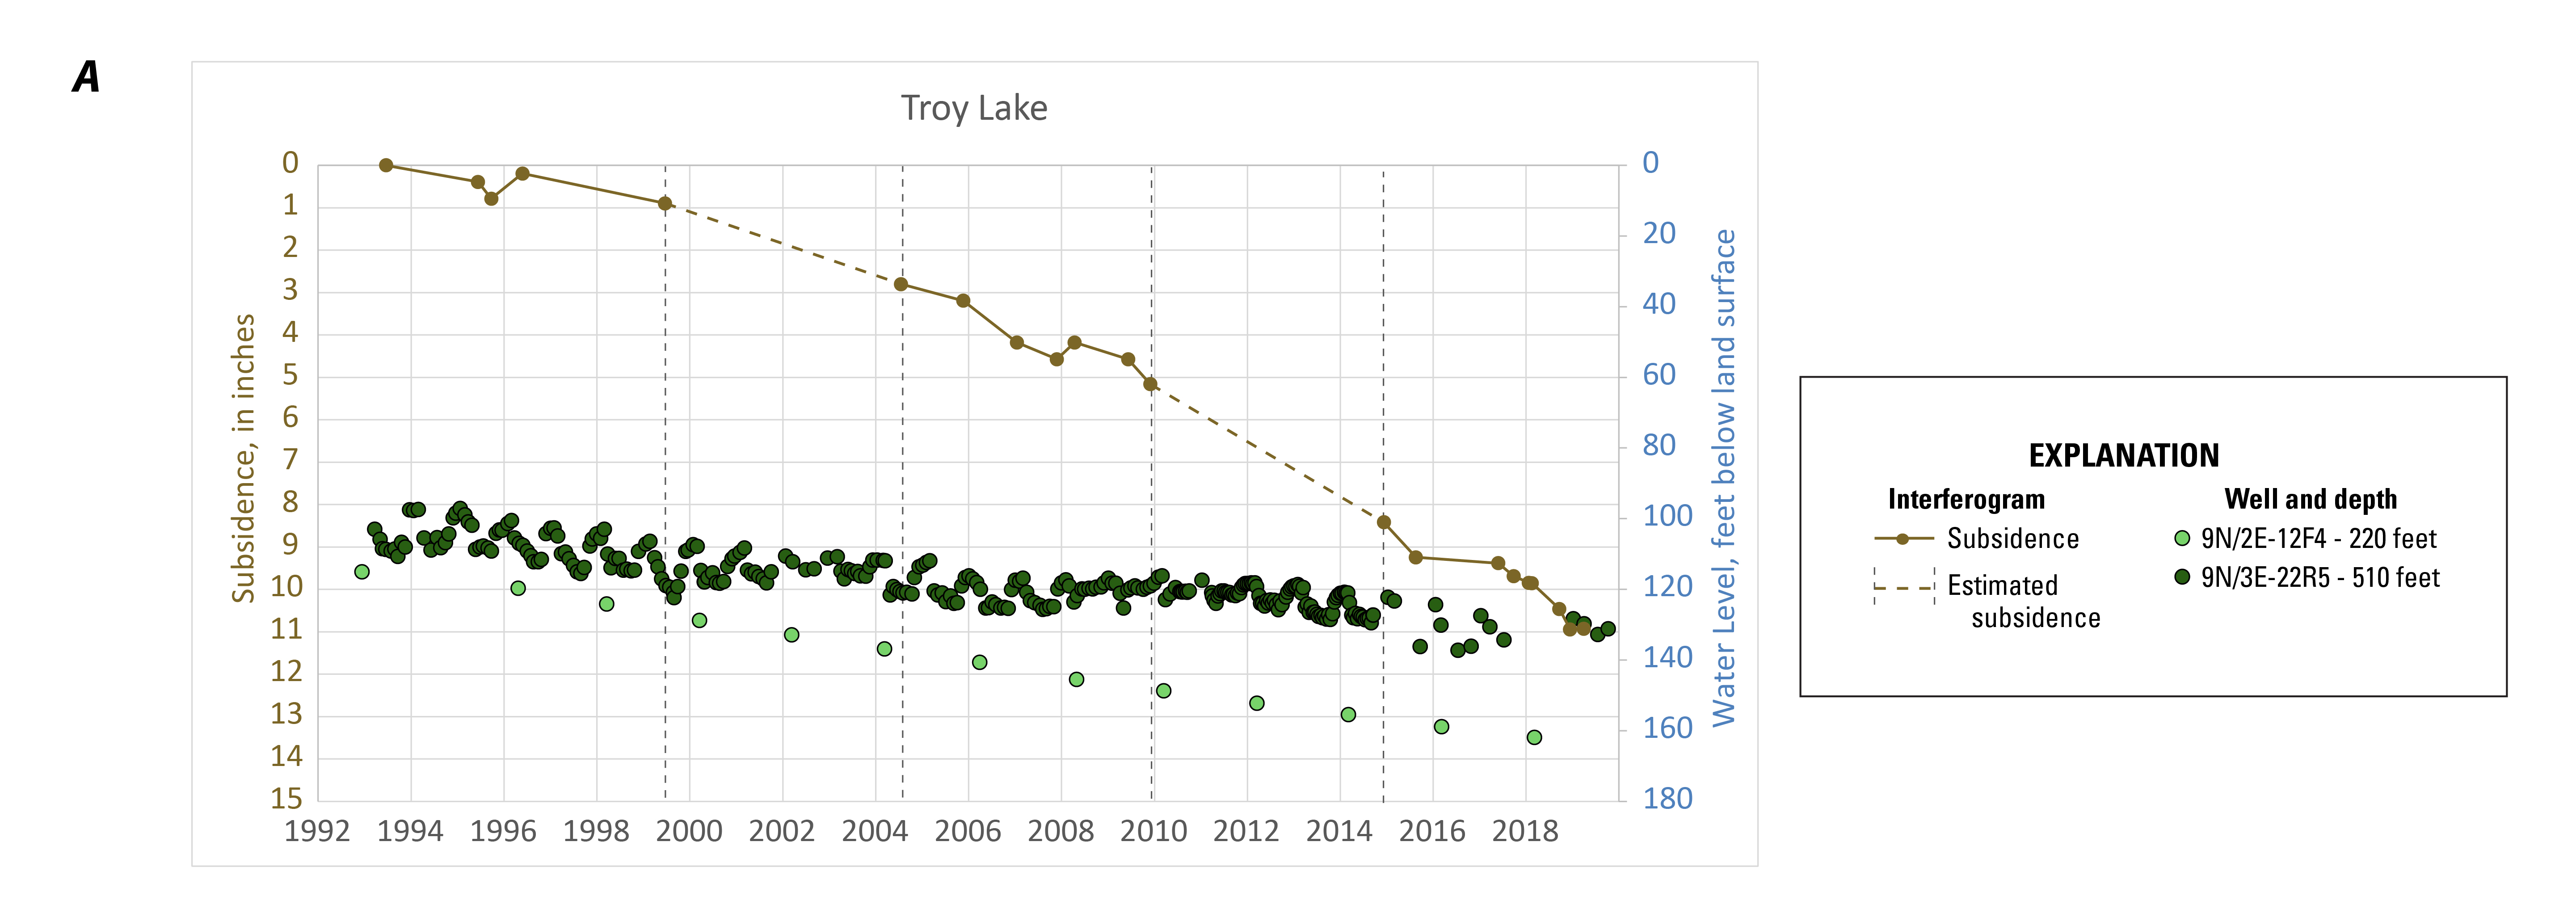
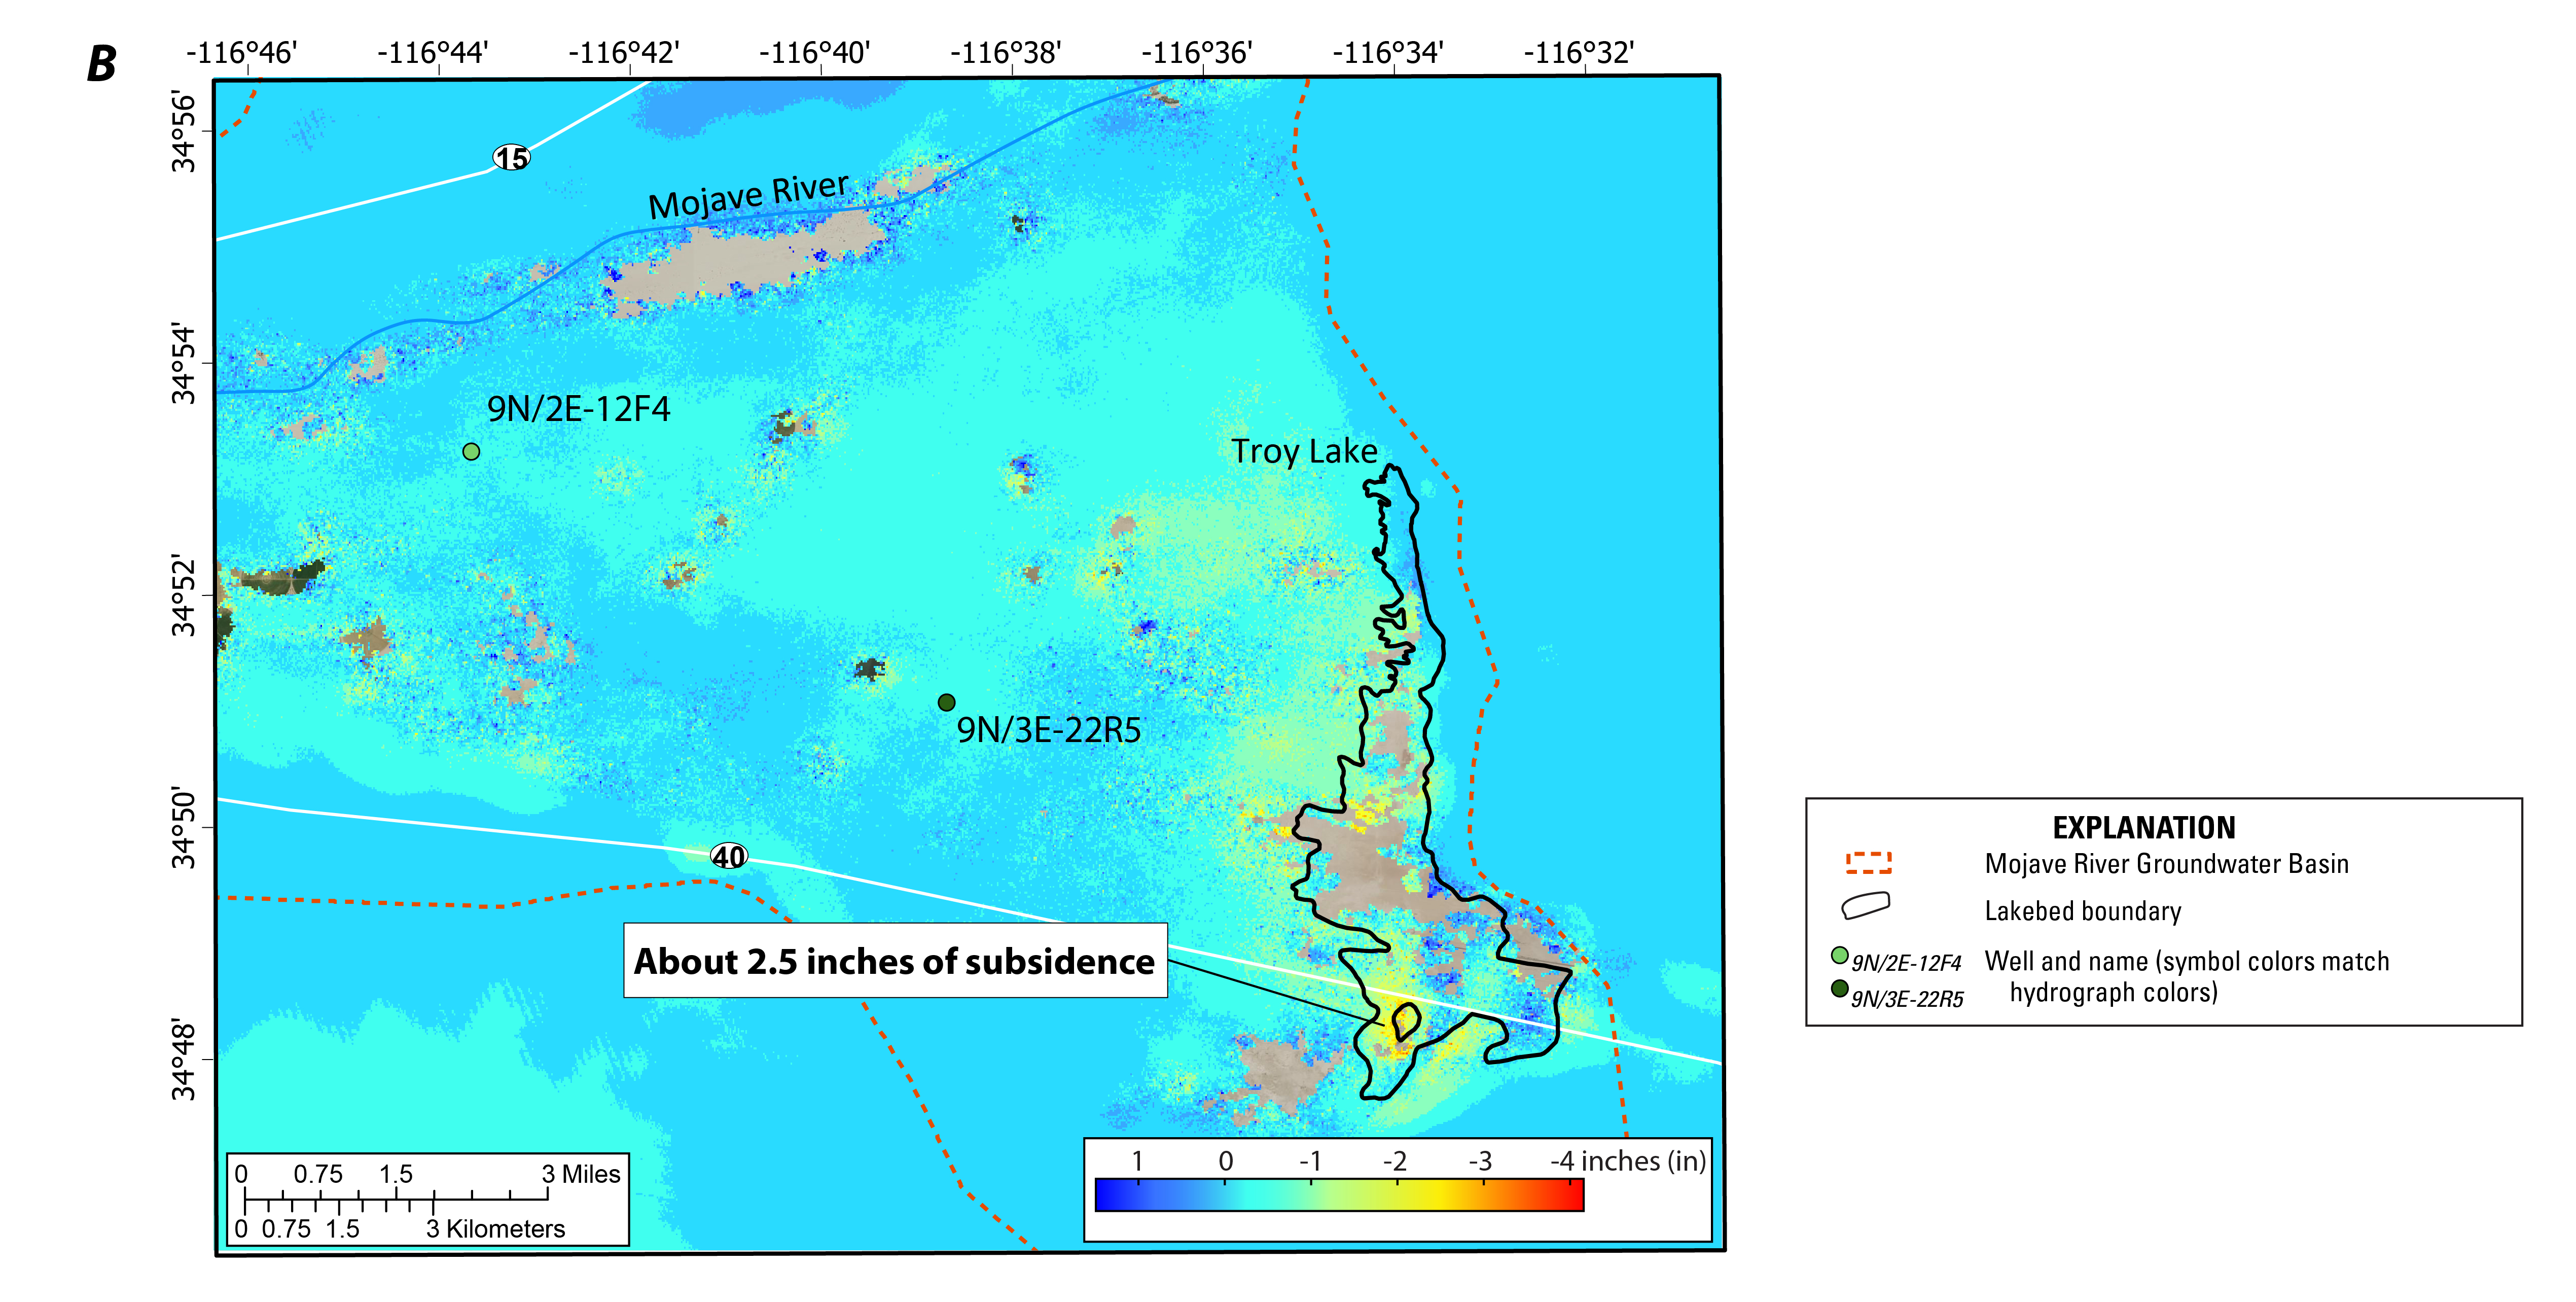
Figure 7: Troy Lake subsidence area, southwestern Mojave Desert, California. A, subsidence and groundwater-level time series for 1992–2019; and B, selected wells overlain on a composite interferogram depicting subsidence during December 2014–March 2019. Blank areas in interferogram were masked because of low pixel correlation. Groundwater-level data are available here. Base map is National Agriculture Imagery Program (NAIP) imagery from 2014.
Summary
Subsidence within the MWA management area occurred in the vicinities of 5 dry lakebeds and was not detected elsewhere. The subsidence primarily resulted from groundwater-level declines in places where highly compressible fine-grained (clay and silt) paleo-lakebed deposits are present. Because water levels measured in wells only represent a small aquifer-system thickness (equivalent to the screened interval) and InSAR-measured subsidence integrates the entire thickness of the aquifer system, numerous unmeasured changes in water levels contribute to observed subsidence. When compared to previous analyses at specific locations, subsidence rates for 2014–19 generally decreased at Lucerne, El Mirage, and Harper Lakes, were steady at Coyote Lake, and increased at Troy Lake.
The decreased subsidence rate at Lucerne, El Mirage, and Harper Lakes may be related to groundwater-level increases in the deeper part of the aquifer system. Groundwater-level increases caused some parts of the aquifer system to expand and offset some of the continued compaction in other parts of the aquifer system. Furthermore, at least some of the compaction that occurred at these three lakes likely was residual because thick clay layers are present and water levels increased when subsidence was measured. At Coyote Lake, less is understood about the subsidence mechanisms because less data were available. The minimal groundwater-level declines near Coyote Lake suggest that unmeasured groundwater-level declines in other parts of the aquifer system may have caused the subsidence. The increased subsidence rate at Troy Lake may be related to the exceedance of preconsolidation stresses in some parts of the aquifer system as water levels declined to historically low levels. At Troy Lake, concurrent and residual compaction likely occurred as water levels persistently declined in some parts of the system, and thick clay layers are present. The extents of the five subsidence areas remained similar for 2014–19 compared to previous studies. The locations of maximum subsidence in each area were consistent with previous analyses except for the Lucerne Lake area, where the area of maximum subsidence during 2014–19 was about 1.5 mi north of the previously identified maximum location. Subsidence was not detected during 2014–19 in other areas of the MWA management area (for example, near the cities of Victorville and Hesperia).
Continued monitoring of groundwater levels and land subsidence in the Mojave River and Morongo groundwater basins will help determine whether groundwater-level declines and subsidence persist in some areas as expected. The analysis of interferograms generated from the InSAR data is the most efficient way to characterize the location, extent, timing, and magnitude of subsidence throughout the nearly 5,000 square-mile MWA management area. Where more detailed studies are of interest, InSAR methods can be used to site ground-based extensometer or GPS monitoring stations. Because InSAR methods are an efficient way to evaluate subsidence over large areas, they can also be used to help water managers direct limited resources to areas and maximize the efficacy of future mitigation measures.
Mojave Region Maps
General Location
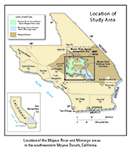
Detailed Location Map
Interactive Data Map
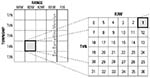
Well-Numbering System

To view PDF documents, you must have Adobe Reader installed on your computer.