Mojave Groundwater Resources
2014 Mojave Region Water-Level Study
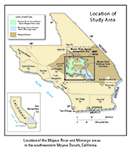
REGIONAL WATER TABLE (2014) IN THE MOJAVE RIVER AND MORONGO GROUNDWATER BASINS, SOUTHWESTERN MOJAVE DESERT, CALIFORNIA by Nick F. Teague, Meghan C. Dick, Sally F. House, and Dennis A. Clark
Groundwater Levels
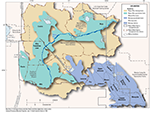
Data for static water-levels measured in about 610 wells during March-April 2014 by the U.S. Geological Survey (USGS), the Mojave Water Agency (MWA), and other local water districts were compiled to construct a regional water-table map. This map shows the elevation of the water table and general direction of groundwater movement in and around the Mojave River and Morongo groundwater basins. Water-level measurements recorded by the USGS and MWA staff were measured and compiled according to the procedures described in the Groundwater Technical Procedures of the U.S. Geological Survey (Cunningham and Schalk, 2011). Water-level data submitted by cooperating local water districts were collected by using procedures established by the corresponding agency, and compiled according to the procedures described in the Groundwater Technical Procedures of the U.S. Geological Survey (Cunningham and Schalk, 2011). All data were compared to historical data for quality-assurance purposes. Water-level contours from the 2012 water-level map (Teague and others, 2014) were used as a guide to interpret and shape the 2014 water-level contours in areas where 2014 water-level data were not available; these contours are shown as dashed (approximate) on the water-table map. In addition to being available on the interactive map, 2014 water-level data and contours are shown for the entire area of the Mojave River and Morongo groundwater basins on Plate 1. Water-level data for 2014 are accesible through the website by clicking the 2014 Sites button on the Data Downloads page.
Water-Level Changes
Historical water-level data from the National Water Information System (NWIS) database were used in conjunction with data collected for this study to construct 37 water-level hydrographs to show long-term (1930-2014) and short-term (1990-2014) water-level changes in the Mojave River and Morongo groundwater basins. Water-level changes between the spring of 2012 and spring of 2014 were determined by comparing water levels measured in the same well during both periods. Water-level changes between any of the study years on this website can also be displayed on the interactive map by selecting the years of interest from the "Water-Level Changes between 2 Years" menu.
Long-Term Water-Level Hydrographs
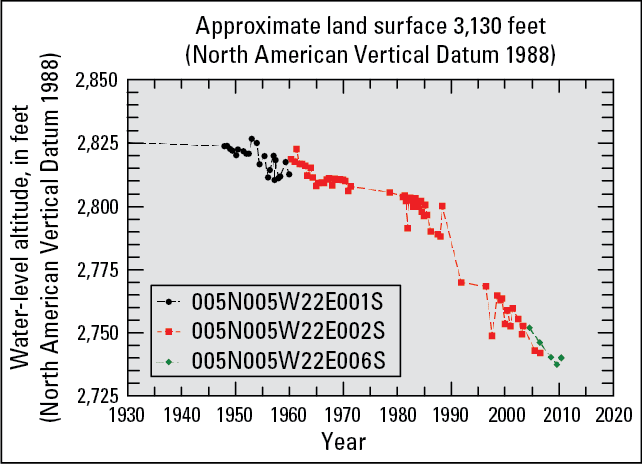
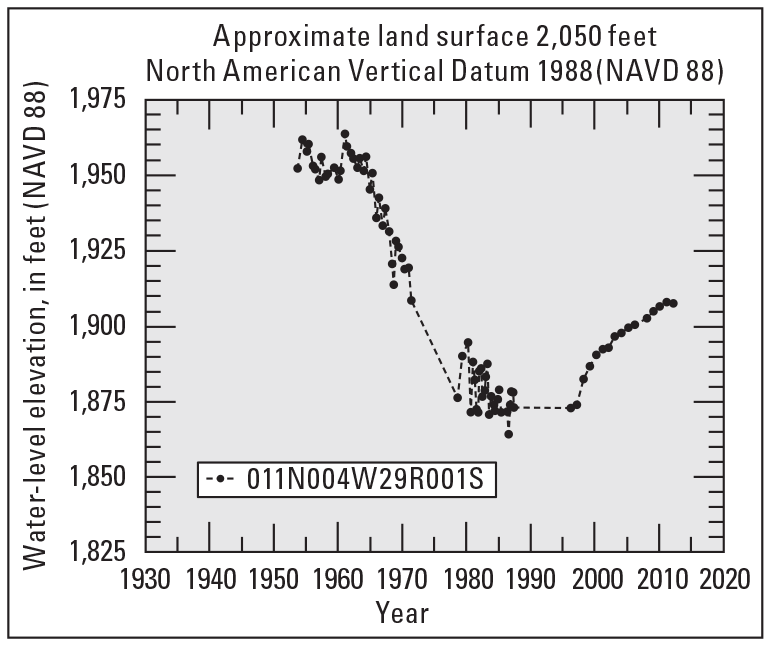
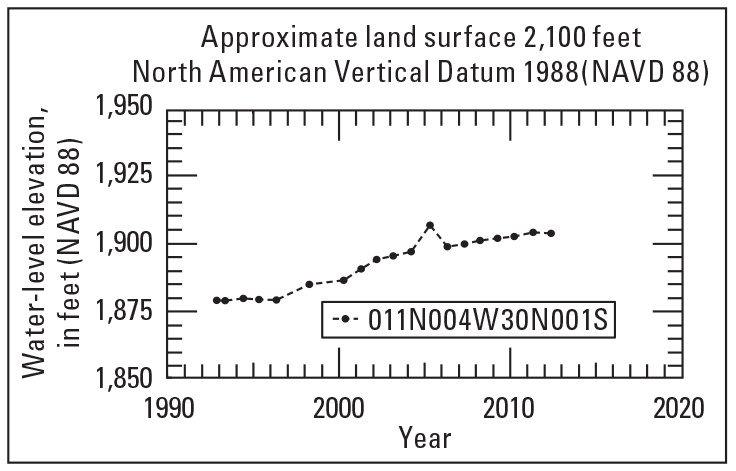
Long-term (1930–2014) water-level changes are depicted by 25 water-level hydrographs (shaded) for the Mojave River and the Morongo groundwater basins. Wells for three hydrographs (wells 5N/5W-22E6, 11N/4W-29R1, and 11N/4W-30N1) were destroyed or were unable to be measured in 2014, but are shown to provide information that is discussed in previous versions of this report.
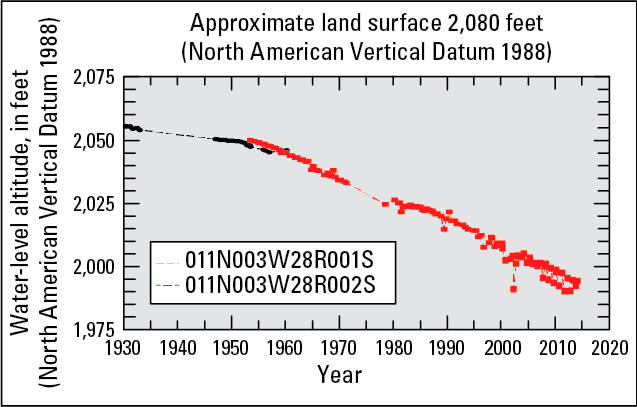
Data from more than one well were combined in hydrographs to show water-level changes over long periods in particular subareas. Combining data from multiple wells onto a single hydrograph was done when a well went dry due to a decline in the water table, or could no longer be measured, and data from a well nearby could be used to continue the record. Data from the different wells are shown by using different colored data points on the hydrographs.
Mojave River Groundwater Basin
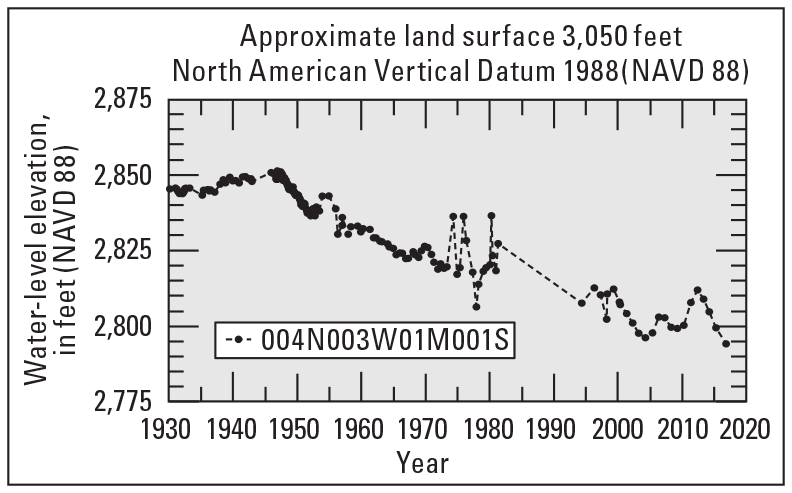
The Mojave River groundwater basin is divided into five subareas. The long-term hydrographs for the Mojave River groundwater basin showed that
- water levels have declined almost 50 feet (ft) east of the Mojave River in the Alto subarea since 1917 (well 4N/3W-1M1),
- water levels have declined more than 60 ft in the eastern part of the Harper Lake region of the Centro subarea since the 1930s (wells 11N/3W-28R1, -28R2),
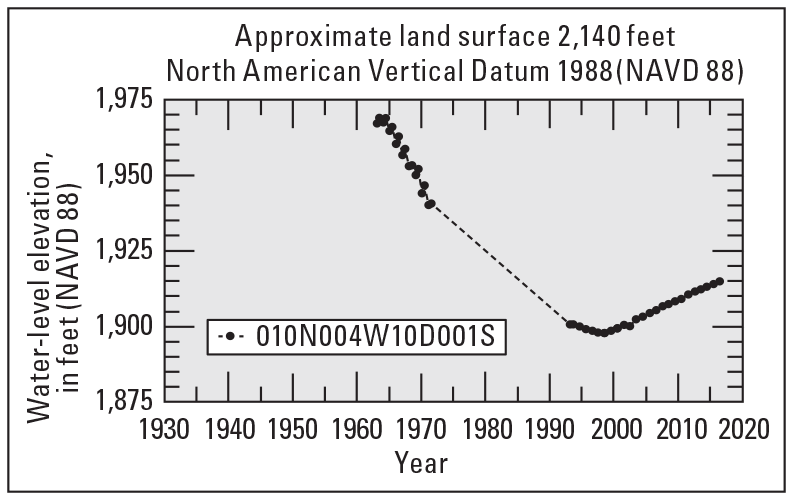
- water levels southwest of Harper Lake (dry) in the Centro subarea (well 10N/4W-10D1) increased from 2001 to 2014 because of a sustained reduction in groundwater pumping since the early 1990s (Mojave Water Agency Watermaster, 2015), and
- in the Baja subarea, water levels have declined more than 105 ft since the late 1940s (wells 9N/2E-20Q1, -20K1, and -20G3).
Morongo Groundwater Basin
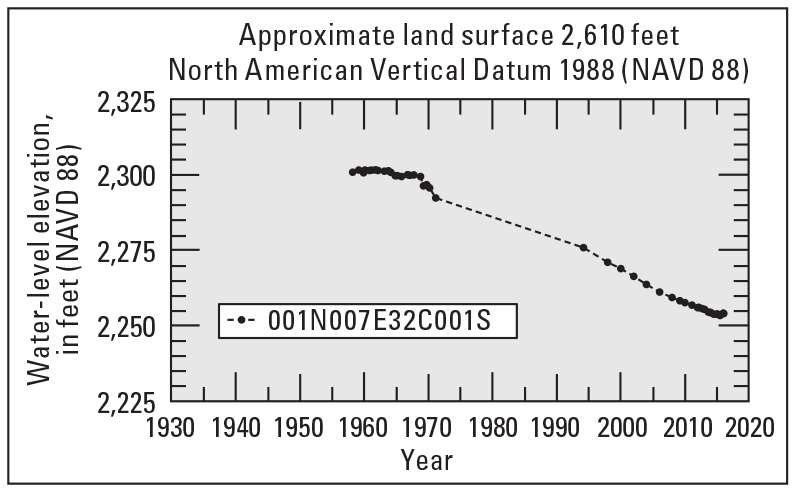
The Morongo groundwater basin is divided into 17 subbasins. All of the long-term hydrographs for the Morongo groundwater basin showed declines in water levels of variable magnitude since the wells were first measured. Water levels have declined
- more than 45 ft in the middle of the Joshua Tree subbasin since the late 1950s (well 1N/7E-32C1),
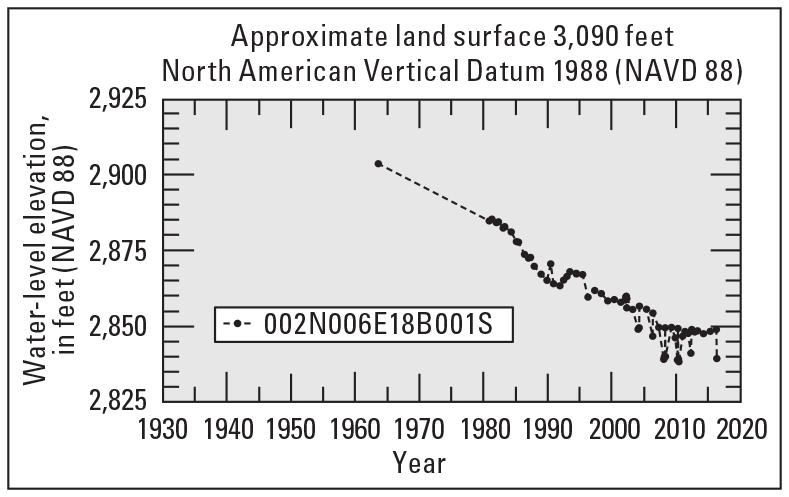
- about 55 ft in part of the Reche subbasin since 1963 (well 2N/6E-18B1),
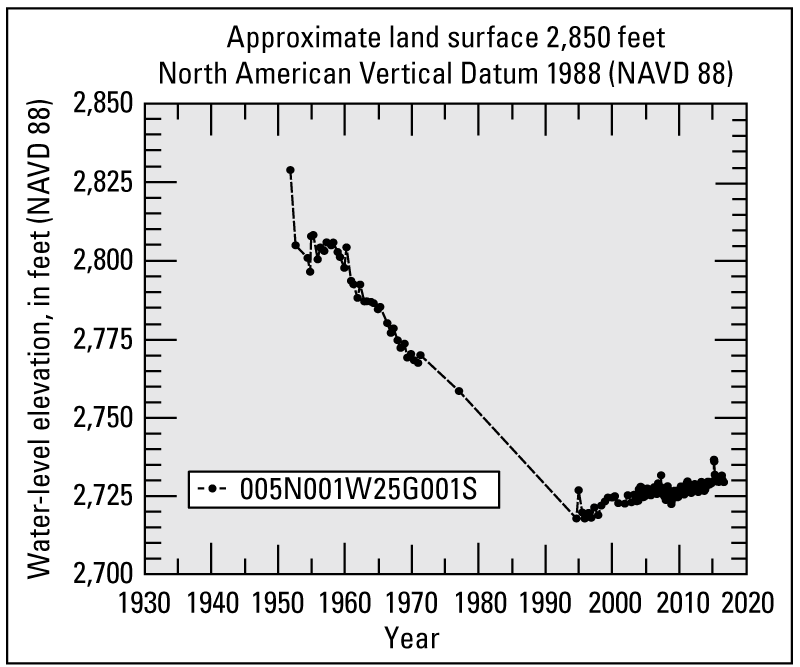
- about 100 ft near Lucerne Lake (dry) in the Lucerne subbasin since the early 1950s (well 5N/1W-25G1),
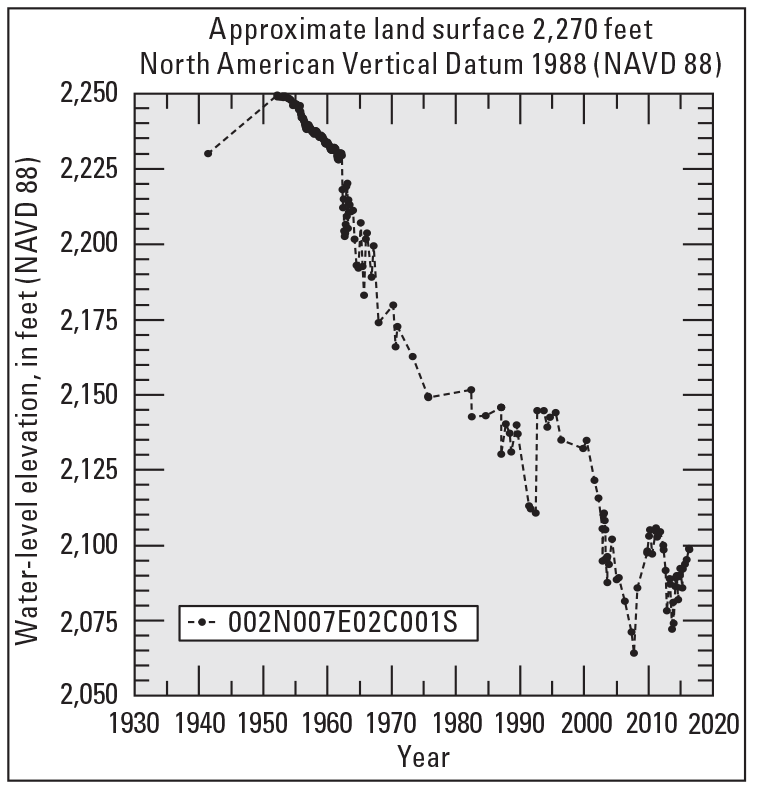
- about 155 ft in the eastern part of the Surprise Spring subbasin since 1952 (well 2N/7E-2C1),
- about 60 ft in the western part of the Warren subbasin (wells 1N/5E-36K1 and -36K2), and
- water levels in the Warren subbasin decreased by as much as 300 ft between 1951 and the early 1990s, but have risen substantially since 1994 in response to artificial recharge with imported water through the use of ponds at the Hi-Desert recharge sites (Stamos and others, 2013).
Short-Term Water-Level Hydrographs
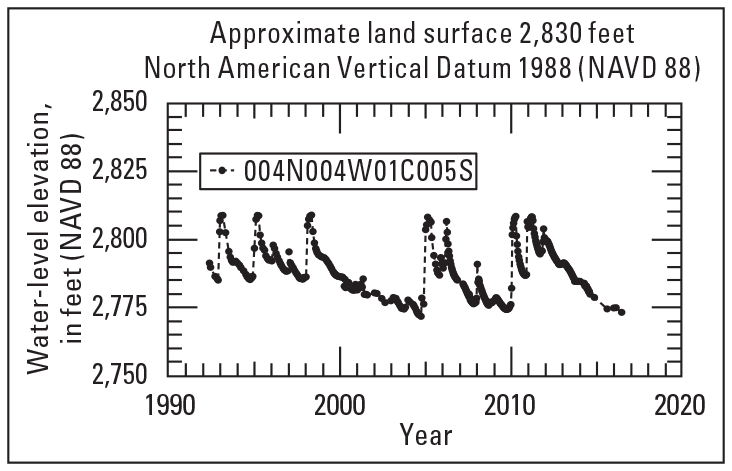
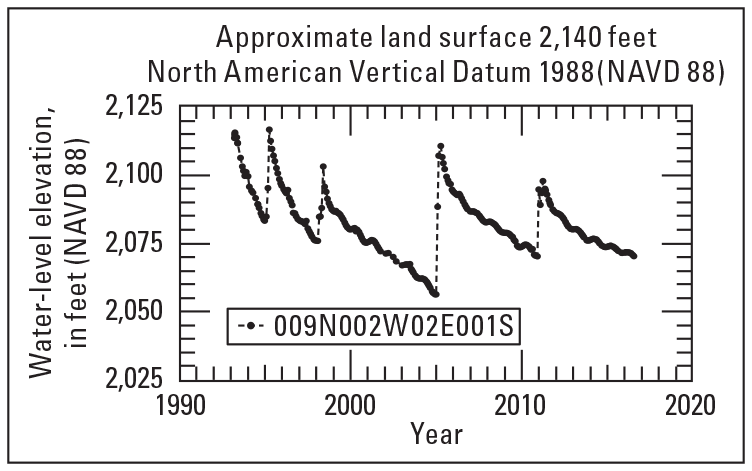
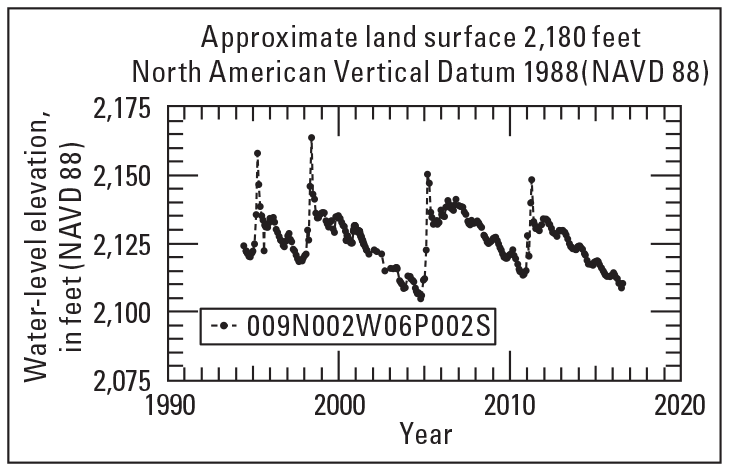
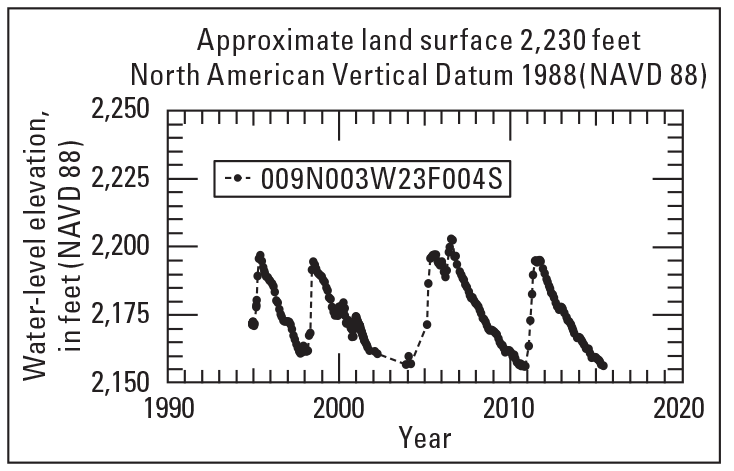
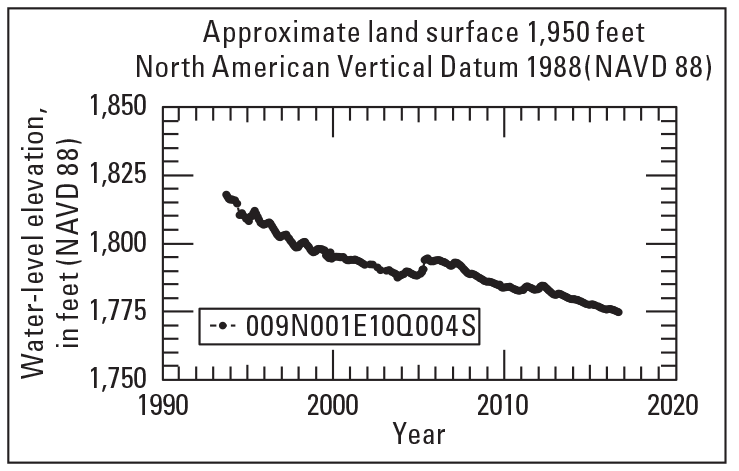
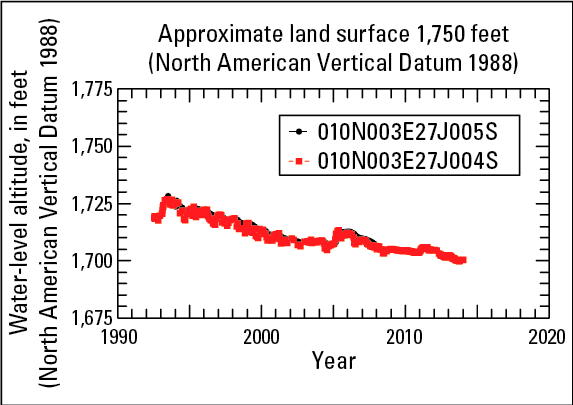
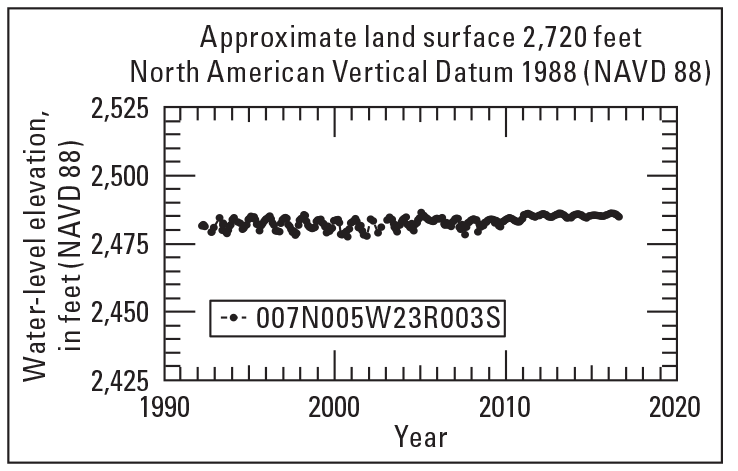
Twelve short-term hydrographs (unshaded) were constructed from data collected between 1990 and 2014 in the Mojave River groundwater basin. Most hydrographs show data from wells that are located along the Mojave River and record the effects of seasonal recharge and discharge along the river, artificial recharge, and evapotranspiration, which is minimal during winter months. These short-term hydrographs show that
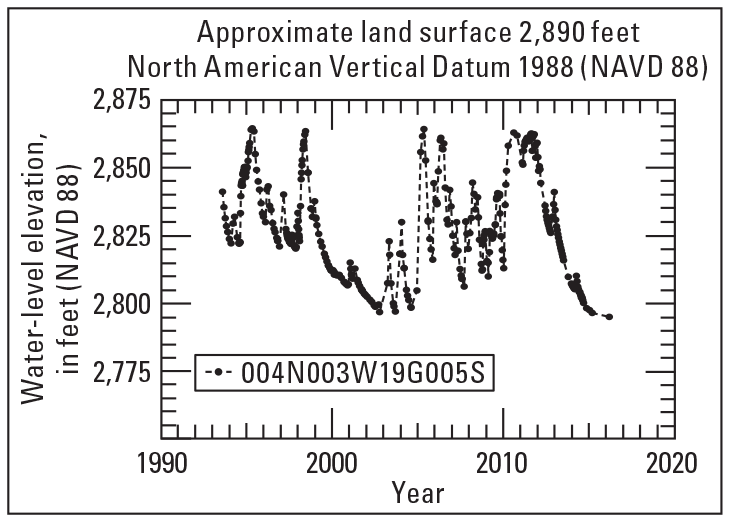
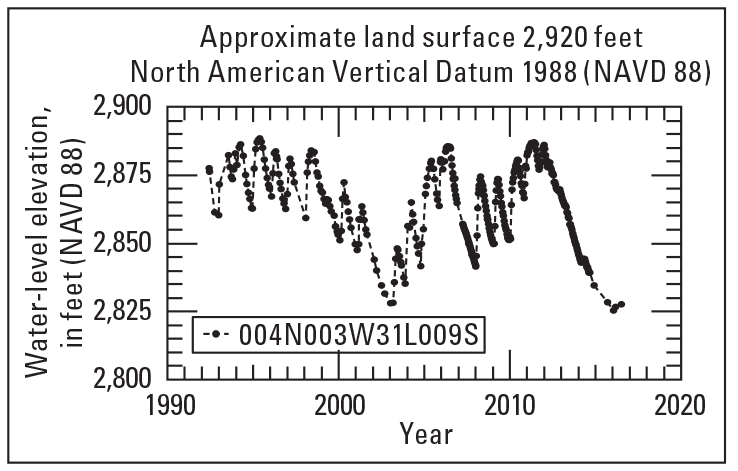
- there has been sporadic recharge to the floodplain aquifer from intermittent stormflows in the Mojave River in the Alto (wells 4N/3W-19G5, -31L9, and 4N/4W-01C5) and Centro (wells 9N/2W-02E1, -06P2, and 9N/3W-23F4) subareas since 1992,
- recharge from stormflows in the Baja (well 9N/1E-10Q4 and 10N/3E-27J4) subarea has been minimal, and
- in the Alto Transition zone, the groundwater levels near well 7N/5W-23R3 have increased slightly as a result of recharge from treated wastewater that is discharged about 4 miles upstream by the Victor Valley Wastewater Reclamation Authority (VVWRA) (location map).
Changes from 2012 to 2014
Water-level changes between spring of 2012 and the spring of 2014 can be viewed by selecting those years on the water-level change map (water-level change maps can be created using the "Water-level Changes between 2 Years" menu). Water-level data exist for 476 wells in the Mojave River and Morongo groundwater basins for both years. In 2014
- about 25 percent of the wells (121) had water levels within 0.5 ft of those in 2012,
- about 35 percent (168) of the wells had water-level declines of between 0.5 and 5 ft,
- about 15 percent (70) of the wells had declines of between 5 and 30 ft,
- 1 percent (6) of the wells had declines of greater than 30 ft,
- about 23 percent of the wells (111) had water-level increases of between 0.5 and 30 ft, and
- one well had a water-level increase of 40 ft.
Mojave River Groundwater Basin
Of the 318 wells assessed within the Mojave River groundwater basin, water-level data shows
- about 20 percent of the wells (65) had water levels within 0.5 ft of those in 2012,
- about 36 percent of the wells (114) had water-level declines of between 0.5 and 5 ft,
- about 16 percent (50) of the wells had declines of between 5 and 15 ft,
- about 4 percent (12) of the wells had declines of between 15 and 30 ft,
- 2 percent (6) of the wells had declines of greater than 30 ft,
- about 15 percent (50) of the wells had increases of between 0.5 and 5 ft,
- about 6 percent (18) wells had increases of between 5 and 15 ft, and
- three wells had water-level increases of 15 ft or more.
Overall, water levels in wells along the Mojave River in the Alto subarea and the Alto Transition zone have remained constant, because of the infiltration resulting from surface flow through the Lower Narrows (10261500) and the treated wastewater discharged by the VVWRA. Data from the Centro and Baja subareas showed that most wells had groundwater-level decreases. A small pumping depression (not shown on the map because of scale) created by efforts to pump and treat contaminated groundwater near Hinkley (11 miles northwest of Barstow), in the Centro subarea, likely decreases flow of groundwater from Hinkley to the north (Dennis Maslonkowski, CH2MHill, written commun., Jan 28, 2013). In the Baja subarea, most wells had water-level declines of between 0.5 and 5 ft. Several wells in the Baja subarea north of the Mojave River showed water-level increases. These increases likely are due to the effects of a reduction in pumpage in that area since 1994 (Mojave Water Agency Watermaster, 1995; Mojave Water Agency Watermaster, 2015).
Morongo Groundwater Basin
Of the 158 wells compared within the Morongo groundwater basin,
- about 35 percent of the wells (56) had water levels within 0.5 ft of those in 2012,
- about 34 percent (54) of the wells had water-level declines of between 0.5 and 5 ft,
- about 5 percent (8) of the wells had declines of greater than 5 ft,
- about 18 percent (29) of the wells had water-level increases of between 0.5 and 5 ft,
- about 6 percent (10) of the wells had increases of between 5 and 30 ft, and
- one well had a water-level increase of 40 ft.
In the Deadman, Mesquite, and Mainside subbasins, these water-level increases can be attributed either to fluctuations in pumpage or the effects from a possible reduction in pumpage (Li and Martin, 2011). The greatest water-level increases continue to be observed in the Warren subbasin, where artificial-recharge operations in Yucca Valley at artificial recharge sites and a reduction in groundwater pumpage (Stamos and others, 2013) have caused water levels to rise more than 250 ft (well 1N/5E-36K2) since 1994.
Suggested Citation:
Teague, N.F., Dick, M.C., House, S.F., and Clark, D.A., 2016, Regional water table (2014) in the Mojave River and Morongo groundwater basins, southwestern Mojave Desert, California, 2016: U.S. Geological Open-File Report 2016–1105 (ver. 3, July 2020), 1 sheet, scale 1:170,000, http://dx.doi.org/10.3133/ofr20161105.
Mojave Region Maps
General Location
Detailed Location Map
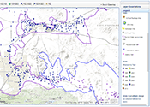
Interactive Data Map
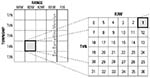
Well-Numbering System

To view PDF documents, you must have Adobe Reader installed on your computer.