California Drought
Drought Resources & Publications
The California Water Science Center publishes water-information on many topics, including drought, and in many formats. From this Web page, you can locate, view, download, or order scientific and technical articles and reports relating to the drought in California.
For general interest publications relating to California water science, such as booklets, fact sheets, pamphlets, and posters resulting from the research performed by our scientists and partners, please visit our Publications page.
California Water Conditions
- Real-Time Data
- Real-Time Streamflow Conditions
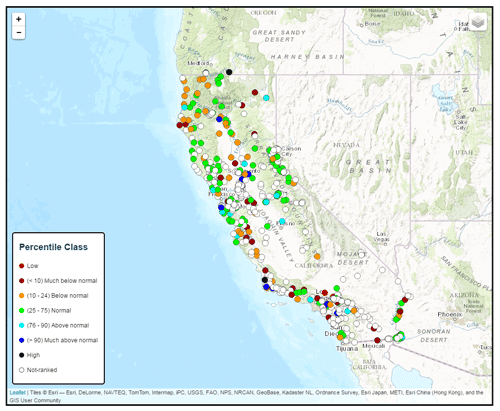
- WaterWatch
- USGS Data Mapper
- Groundwater
- Groundwater Data
- Groundwater Watch
- Regional Groundwater
- Surface Water
- Surface-Water Data
- Surface-Water Watch
- Water-Quality
- Water-Quality Data
- Water-Quality Watch
- Water Info via Email/Text
- (WaterNow / StreaMail)

California Drought Resources
State Water Board Drought Year Watershed Analyses
Since 2014, due to severe drought conditions, annual water availability analyses are performed to determine allocations to water right holders. Water availability analyses are available through water year 2017 (September 30, 2018) and are updated on a weekly basis.
U.S. Drought Monitor
The U.S. Drought Monitor, established in 1999, is a weekly map of drought conditions that is produced jointly by the National Oceanic and Atmospheric Administration, the U.S. Department of Agriculture, and the National Drought Mitigation Center (NDMC) at the University of Nebraska-Lincoln.
National Oceanic and Atmospheric Administration (NOAA)
- Drought Termination and Amelioration
Based on Palmer drought analysis, the precipitation required to end or ameliorate drought in 6 timescales (1- to 6-months), the percent of normal precipitation this amount is, and the probability of receiving this amount of precipitation based on the historical record. - Climate Outlook Maps
Monthly and seasonal color outlook maps for temperature and precipitation. - State of the Climate -- Drought
Discussion of U.S. drought status, with narrative and graphics.
Natural Resources Conservation Service (NRCS)
- Weekly Water and Climate Update
These updates includes weather, precipitation, temperature and drought highlights, as well as drought and fire potential outlooks. - Snow Telemetry (SNOTEL) data
Includes snow water equivalent, precipitation, temperature, snow depth and soil moisture/temperature data. - Snow Water Equivalent Update Graph
Provides snow water equivalent data (percent of median) for each California basin that receives snowfall. - Year-to-Date Precipitation Update Graph
Provides year-to-date precipitation data (percent of average) for each California basin that receives snowfall.
California Department of Water Resources (DWR)
- California Data Exchange Center
The California Data Exchange Center (CDEC) installs, maintains, and operates an extensive hydrologic data collection network including automatic snow reporting gages for the Cooperative Snow Surveys Program and precipitation and river stage sensors for flood forecasting. - Drought and Water Year 2016: Hot and Dry Conditions Continue
2016 California Drought Update - Current Reservoir Conditions
Daily graphs of reservoir storage data, including percent of capacity and percent of historical average. - Daily California Reservoir Data
Daily updates of storage, inflow and outflow measurements at each of California's Reserviors, listed by river basin. - Drought Information
Portal of DWR's drought resources, including current water conditions, general drought and water conservation information, and technical assistance.
National Weather Service
Official U.S. weather, marine, fire and aviation forecasts, warnings, meteorological products, climate forecasts and information about meteorology.
California Drought, Visualized with Open Data
This website graphically visualizes data to help understand the effect of drought on rivers, streams, lakes, and reservoirs.
Vegetation Mapping
This interactive map service provides regularly updated geospatial data related to drought conditions, including eMODIS VegDRI, AVHRR VegDRI, 7-Day Average Streamflows (USGS Water Watch), Precipitation Derivatives (NWS Precipitation Analysis), and the weekly U.S. Drought Monitor.
Where Does My Water Come From? (Water Education Foundation)
Website listing the drinking water sources for incorporated cities with a population of 10,000 or greater.