Regional Hydrology

California Basin Characterization Model: A Dataset of Historical and Future Hydrologic Response to Climate Change
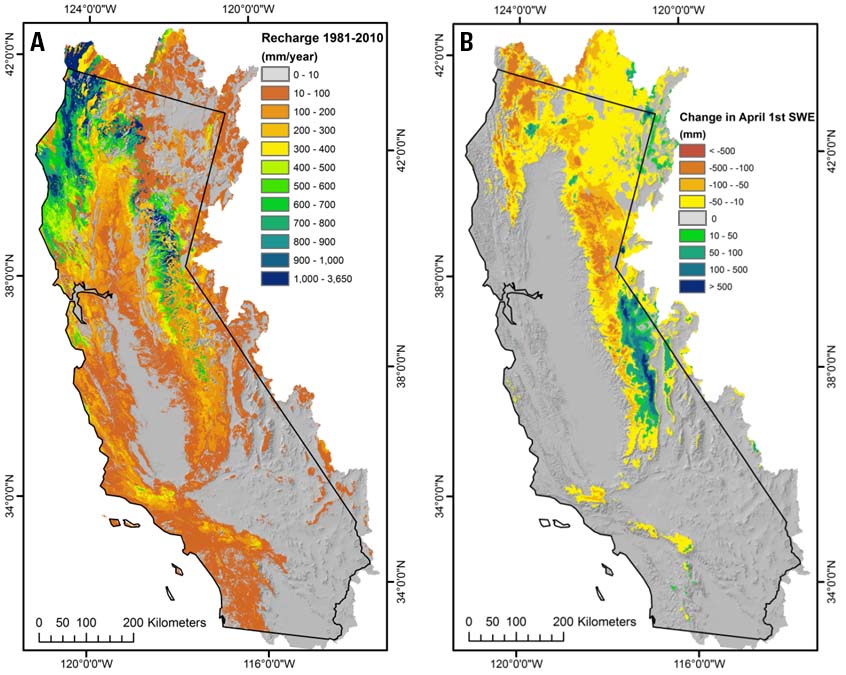
Figure 1. Maps of hydrologic output variables for (A) average recharge (net infiltration below the root zone) for water years 1981-2010 and (B) change in average April 1st snow water equivalent (SWE) between 1951-1980 and 1981-2010 calculated by the Basin Characterization Model for the California hydrologic region.
Ongoing changes in climate are influencing water resources throughout the world, by reducing snowpack and causing snow to melt earlier in the spring, which are among the most important challenges to water availability. Climate change also impacts landscapes, vegetation and species, and agriculture, by causing longer dry seasons, more frequent extreme storms, fewer chilling hours, and higher snowlines.
Information available to inform land and resource managers is generally composed of model projections of precipitation and air temperature trends with coarse spatial detail. A recently developed tool, the Basin Characterization Model (BCM), can translate fine-scale maps of climate trends and projections into the hydrologic consequences, to permit evaluation of the impacts to water availability at regional, watershed, and landscape scales, as caused by changes in temperature and precipitation.
The Basin Characterization Model (Flint and others, 2013) was used to calculate a monthly water balance for the California hydrologic region (Figure 1), which includes all basins draining into the state. The model was developed at a 270-m spatial resolution, using monthly data, and has been supported by numerous federal, state, and local agencies, and international organizations. The BCM uses historical climate data from 1896-2010, and an ensemble of 18 future climate projections that were used to develop hydrologic output such as snowpack, recharge, runoff, and climatic water deficit. To produce this dataset, digital maps of soils and geology for the California hydrologic region were integrated with monthly maps of climate and hydrology, to generate average water year and 30-year water year maps for the historical record (1951-1980 and 1981-2010) and future projections (2010-2039, 2040-2069, and 2070-2099). This report describes the resulting downscaled climate and hydrologic output for the historical and future dataset produced by the California BCM. Details of the development methodology, calibration, uncertainty, and application to the California hydrologic region can be found in Flint and others (2013). Analyses of some of the future conditions can be found in Flint and Flint (2012), Thorne and others (2012), and Thorne and others (2013).
Model Releases
Development of a Monthly Dataset of Historical (1896-2010) and 18 Projected Futures (2011-2099) for Climate and Hydrology for the California Hydrologic Region
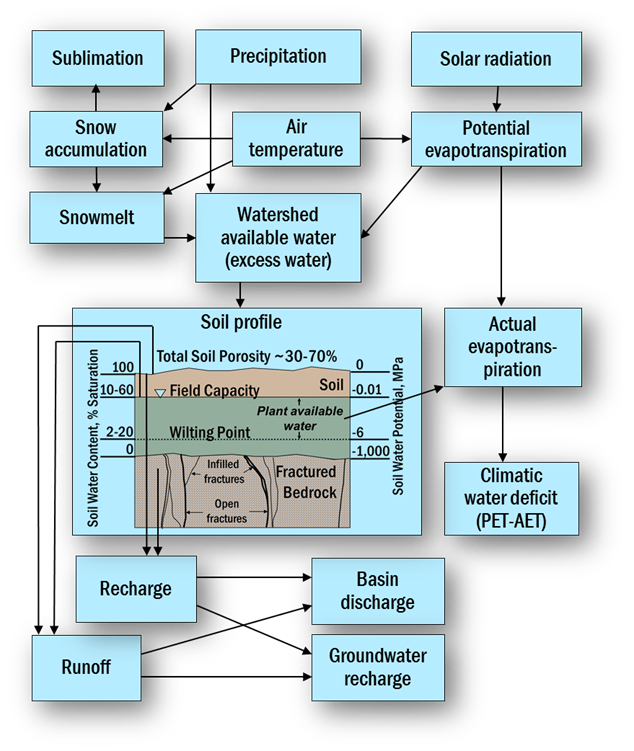
Figure 2. Schematic describing relation of components of the Basin Characterization Model (from Thorne and others, 2012).
The Basin Characterization Model (BCM) is a simple grid-based model that calculates the water balance (Figure 2) for any time step or spatial scale by using climate inputs, precipitation, minimum and maximum air temperature. Potential evapotranspiration is calculated from solar radiation with topographic shading and cloudiness, snow is accumulated, sublimated, and melted (sublimation, snowfall, snowpack, snowmelt), and excess water moves through the soil profile, changing the soil water storage. Changes in soil water are used to calculate actual evapotranspiration, and when subtracted from potential evapotranspiration calculates climatic water deficit. Depending on soil properties and the permeability of underlying bedrock, water may become recharge or runoff. Routing is done via post-processing to estimate baseflow, streamflow, and groundwater recharge (see Flint and others, 2013). Monthly downscaled climate inputs and hydrologic output variables (Table 1) can be examined for any size polygon representing regions or watersheds, or the distribution across the landscape.
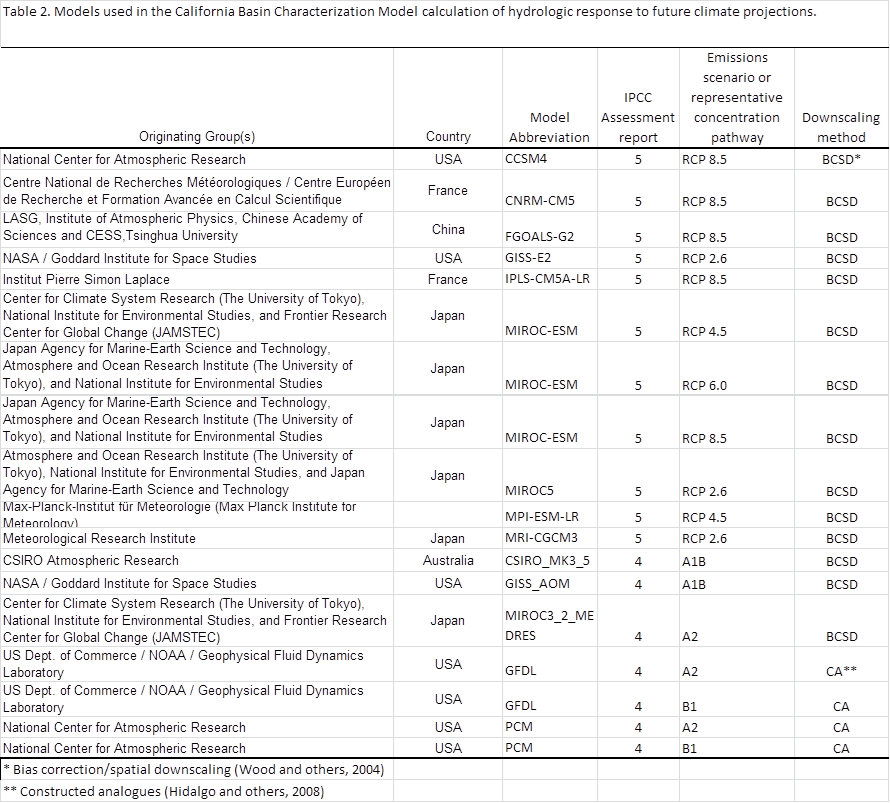
A selection of future climate projections includes an ensemble of models from the World Climate Research Programme's (WCRP's) Coupled Model Intercomparison Project phase 3 (CMIP3) multi-model dataset (Meehl and others, 2007) and the Coupled Model Intercomparison Project phase 5 (CMIP5) (Taylor and Stouffer, 2012). These two datasets represent models from both IPCC 4th (IPCC, 2007) and 5th (scheduled for publication late 2013) assessment reports and provide a range of projected climatic conditions, from warm and wet to hot and dry (Weiss and others, in review). The models and descriptions are included in Table 2.
Input data used to produce the BCM outputs, and included as available data are gridded monthly climate data from PRISM (Daly and others, 2008), geology (Jennings 1977), and water content at field capacity and wilting point, porosity, and depth from SSURGO soil databases (NRCS 2006). Also included in the dataset are annual values for precipitation, minimum and maximum air temperature, potential evapotranspiration, actual evapotranspiration, climatic water deficit, runoff and recharge calculated for western water years (October 1 to September 30), and April 1st snowpack. Statistics calculated on 30-year periods (1951-1980 and 1981-2010) and futures (2010-2039, 2040-2069, and 2070-2099) include mean, detrended standard deviation, standard deviation, coefficient of variation, mean winter air temperature (December, January, February; DJF) and mean summer air temperature (June, July, August; JJA). For model application, all climate data was spatially downscaled from the original spatial resolution (historical PRISM at 800-m) or future climate projections (12-km) according to a methodology described in Flint and Flint (2012).
Table 1. Input climate and output hydrology variables for the Basin Characterization Model, with codes used in filenames, and description of calculations (from Thorne and others, 2012). [C, celsius; mm, millimeter; BCM, Basin Characterization Model;
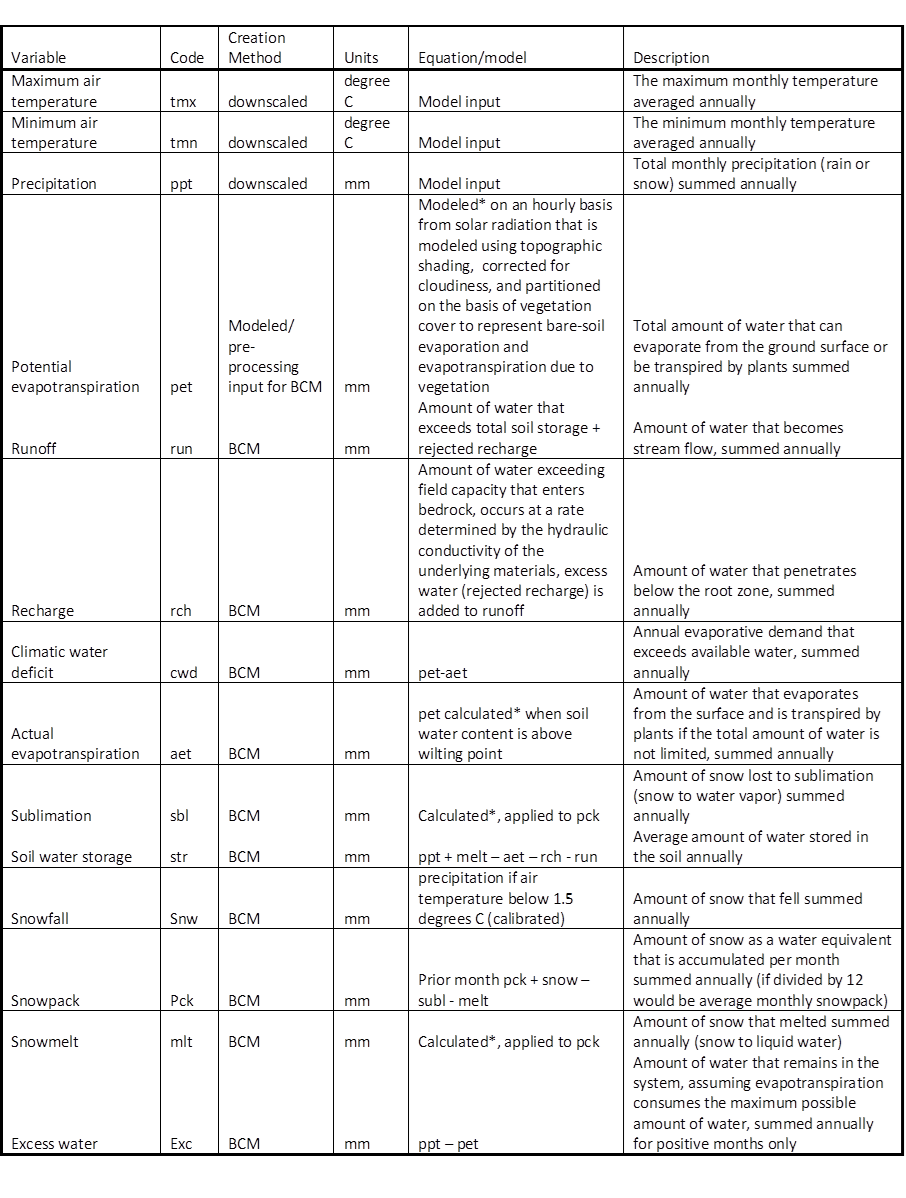
Table 2. Models used in the California Basin Characterization Model calculation of hydrologic response to future climate projections.
Climate and Hydrology Results for Historical (1900-2010) and 18 Projected Futures (2011-2099) for the California Region
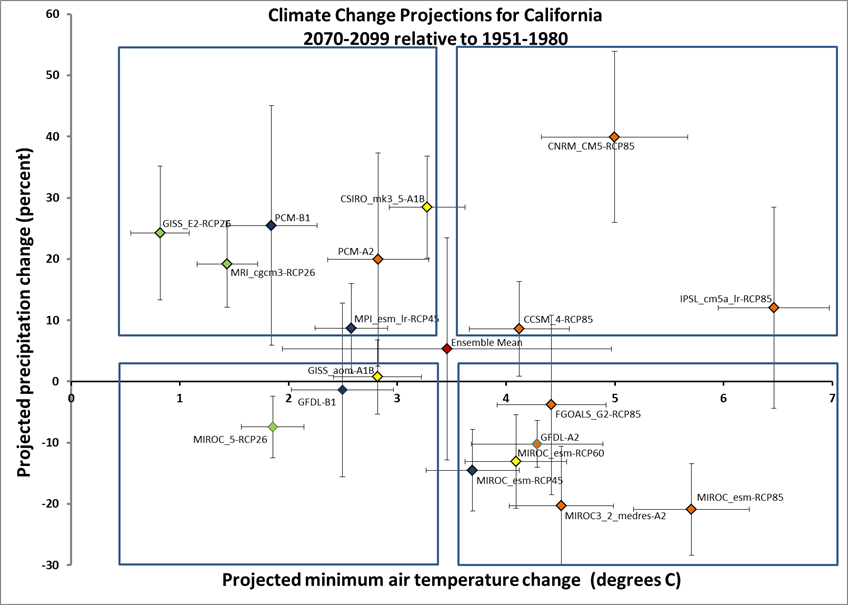
Figure 3. Projected change in precipitation and minimum air temperature for 30-year water year means between 1951-1980 and 2070-2099 for 18 future climate projections. Bars indicate the range of values for all cells in the California hydrologic region and boxes indicate general direction of precipitation and temperature change in comparison to the ensemble mean.
The 18 climate change projections span a range of potential future climate, with all air temperature projections higher by the end of the 21st century, and variable changes in precipitation (Figure 3).
Basin Characterization Model Data Downloads
Climate and hydrologic data for these projections at 270-m is available via web-based download for the California hydrologic region or selected subsets.
WY2011-WY2016 Update (version 1.1)
The California Basin Characterization Model has been updated to include water years 2011-2016. These results are derived using all methods and protocols described on the methods tab. Data availability and access differs as the updates are not available on the USGS GeoData Portal, but can be downloaded directly here. Data are available as netCDF files for each variable with monthly maps aggregated into water year files.
The projection is California Teale Albers NAD83.
First release: 2014
Second release: 2017, to append the WY2011-WY2016 Update and related updated metadata
Metadata
| Dataset | File Size | Last Modified |
|---|---|---|
| FGDC Metadata (XML) | 16 KB | 2017-05-18 |
WY2011-WY2016 Datasets
| Dataset | 2011 | 2012 | 2013 | 2014 | 2015 | 2016 | Last Modified |
|---|---|---|---|---|---|---|---|
| Climatic Water Deficit | NetCDF (731.65 MB) ASCII (91.28 MB) |
NetCDF (731.65 MB) ASCII (91.28 MB) |
NetCDF (731.65 MB) ASCII (91.28 MB) |
NetCDF (731.65 MB) ASCII (91.28 MB) |
NetCDF (731.65 MB) ASCII (91.28 MB) |
NetCDF (731.65 MB) ASCII (91.28 MB) |
2017-07-07 |
| Evapotranspiration (Actual) | NetCDF (731.65 MB) ASCII (93.52 MB) |
NetCDF (731.65 MB) ASCII (84.54 MB) |
NetCDF (731.65 MB) ASCII (86.5 MB) |
NetCDF (731.65 MB) ASCII (82.36 MB) |
NetCDF (731.65 MB) ASCII (100.97 MB) |
NetCDF (731.65 MB) ASCII (85.67 MB) |
2017-07-07 |
| Evapotranspiration (Potential) | NetCDF (731.65 MB) ASCII (88.56 MB) |
NetCDF (731.65 MB) ASCII (88.56 MB) |
NetCDF (731.65 MB) ASCII (88.56 MB) |
NetCDF (731.65 MB) ASCII (88.56 MB) |
NetCDF (731.65 MB) ASCII (88.56 MB) |
NetCDF (731.65 MB) ASCII (88.56 MB) |
2017-07-07 |
| Precipitation | NetCDF (731.65 MB) ASCII (137.98 MB) |
NetCDF (731.65 MB) ASCII (121.16 MB) |
NetCDF (731.65 MB) ASCII (124.67 MB) |
NetCDF (731.65 MB) ASCII (119 MB) |
NetCDF (731.65 MB) ASCII (260.91 MB) |
NetCDF (731.65 MB) ASCII (123.35 MB) |
2017-07-07 |
| Recharge | NetCDF (731.65 MB) ASCII (43.92 MB) |
NetCDF (731.65 MB) ASCII (26.74 MB) |
NetCDF (731.65 MB) ASCII (28.22 MB) |
NetCDF (731.65 MB) ASCII (19.53 MB) |
NetCDF (731.65 MB) ASCII (27.70 MB) |
NetCDF (731.65 MB) ASCII (30.33 MB) |
2017-07-07 |
| Runoff | NetCDF (731.65 MB) ASCII (39.85 MB) |
NetCDF (731.65 MB) ASCII (22.68 MB) |
NetCDF (731.65 MB) ASCII (22.46 MB) |
NetCDF (731.65 MB) ASCII (17.06 MB) |
NetCDF (731.65 MB) ASCII (21.11 MB) |
NetCDF (731.65 MB) ASCII (29.99 MB) |
2017-07-07 |
| Snowpack | NetCDF (731.65 MB) ASCII (41.31 MB) |
NetCDF (731.65 MB) ASCII (24.93 MB) |
NetCDF (731.65 MB) ASCII (32.74 MB) |
NetCDF (731.65 MB) ASCII (17.41 MB) |
NetCDF (731.65 MB) ASCII (18.76 MB) |
NetCDF (731.65 MB) ASCII (36.78 MB) |
2017-07-07 |
| Temperature (Minimum Monthly) | NetCDF (731.65 MB) ASCII (111.68 MB) |
NetCDF (731.65 MB) ASCII (111.68 MB) |
NetCDF (731.65 MB) ASCII (111.68 MB) |
NetCDF (731.65 MB) ASCII (111.68 MB) |
NetCDF (731.65 MB) ASCII (111.68 MB) |
NetCDF (731.65 MB) ASCII (111.68 MB) |
2017-07-07 |
| Temperature (Maximum Monthly) | NetCDF (731.65 MB) ASCII (119.12 MB) |
NetCDF (731.65 MB) ASCII (118.3 MB) |
NetCDF (731.65 MB) ASCII (117.98 MB) |
NetCDF (731.65 MB) ASCII (117.52 MB) |
NetCDF (731.65 MB) ASCII (117.1 MB) |
NetCDF (731.65 MB) ASCII (117.21 MB) |
2017-07-07 |
References
Daly, C., Halbleib, M., Smith, J.I., Gibson, W.P., Doggett, M.K., Taylor, G.H., Curtis, B.J., Pasteris, P.P., 2008, Physiographically sensitive mapping of climatological temperature and precipitation across the conterminous United States: Int J Climatol 28:2031-2064.
Flint, L.E., Flint, A.L., 2012, Downscaling future climate scenarios to fine scales for hydrologic and ecological modeling and analysis: Ecological Processes 2012 1:1. doi:10.1186/2192-1709-1-2
Flint, L.E., Flint, A.L., Thorne, J.H., and Boynton, R., 2013, Fine-scale hydrologic modeling for regional landscape applications: the California Basin Characterization Model development and performance: Ecol. Processes 2:25.
Hidalgo, H.G., Dettinger, M.D., Cayan, D.R., 2008, Downscaling with constructed analogues: daily precipitation and temperature fields over the United States: Calif Energy Comm PIER Energy-Related Environ Res. CEC-500-2007-123.
IPCC, 2007, IPCC Fourth Assessment Report: Climate change 2007; synthesis report. Core writing team, Pachauri, R. K. and Reisinger A. (Eds). International Panel on Climate Change, Geneva Switzerland.
Jennings, C.W., 1977, Geologic map of California. California Division of Mines and Geology geologic data: Map number 2, scale 1:750,000.
Meehl, G.A., Covey, C., Delworth, T., Latif, M., McAvaney, B., Mitchell, J.F.B., Stouffer, R.J., and Taylor, K.E., 2007, The WCRP CMIP3 multi-model dataset: A new era in climate change research: Bulletin of the American Meteorological Society, 88, 1383-1394.
NRCS (Natural Resources Conservation Service), 2006, U.S. General Soil Map (SSURGO/STATSGO2): Data, Description
Taylor, K.E., R.J. Stouffer, G.A. Meehl: An Overview of CMIP5 and the experiment design. Bull. Amer. Meteor. Soc., 93, 485-498, doi:10.1175/BAMS-D-11-00094.1
Thorne, J.H., Boynton, R., Flint, L.E., Flint, A.L., Le, T.N., 2012, Development and application of downscaled hydroclimatic predictor variables for use in climate vulnerability and assessment studies: CEC-500-2012-010. California Energy Commission, Sacramento.
Wood, A.W., Leung, L.R., Sridhar, V., and Lettenmaier, D.P., 2004, Hydrologic implications of dynamical and statistical approaches to downscaling climate model outputs: Climatic Change, 62, 189-216.
Calculating the water balance: A provisional dataset using the Basin Characterization Model version 8 (BCMv8)
Water balance modeling
The water balance calculations performed by the Basin Characterization Model (BCM; Flint and others, 2013) are unimpaired estimates and solve the following equation monthly:
precipitation – evapotranspiration – sublimation- runoff – recharge – delta soil storage = 0
in comparison to the standard water budget of a basin, which incorporates all inputs and outputs including withdrawals, diversions, and deliveries. On a monthly basis you only have excess water that can infiltrate into the soil when precipitation > potential evapotranspiration (PET), and depending on the actual evapotranspiration (AET) of the vegetation. If you're lucky enough to have snow in your basin, the "supply" can be delayed later into the water year.
Recharge and runoff
Recharge is defined as water that infiltrates into the soil and moves below the zone of evapotranspiration, and may proceed to the groundwater aquifer or return to the surface as baseflow in streams or discharge in springs. Runoff does not infiltrate into the soil. These hydrologic processes can be generalized and described as having different magnitudes and pathways depending on whether the climate is mesic or xeric (Figure 1). Recharge and runoff in your watershed may go into unsaturated bedrock or alluvial deposits in xeric regions, whereas little recharge will remain in a mesic watershed, becoming baseflow to streams (Figure 2). In watersheds with low bedrock permeability the runoff exceeds recharge and both leave the watershed early in the water year. In permeable watersheds, recharge may exceed runoff and will be stored in soils and bedrock later into the season, extending baseflows and contributing to groundwater systems in xeric regions or when multiple dry years have dried the soils and lowered the water tables. In mesic climates with higher precipitation and lower PET, AET may extend further through the dry season, whereas soil water is depleted earlier in the season in xeric climates and AET stops. Correspondingly recharge and runoff are larger and may extend further into the dry season in mesic climates, especially in locations with snowpack. Alternately, recharge is often larger than runoff in xeric climates due to the high evaporative demand and room in soils for water. In locations with high precipitation, recharge may fill soils and create runoff. Whether precipitation becomes recharge or runoff in the watershed depends on the climate and physical properties of each watershed.
BCMv8
BCMv8 is a refined version of the Basin Characterization Model (v65, Flint and others, 2013; Flint and Flint, 2014). It has been revised to include 7 new features;
- monthly vegetation-specific actual evapotranspiration for 65 vegetation types (Figure 3a),
- spatially distributed calibration coefficients for snow accumulation and snowmelt,
- mapped soil organic matter,
- soil hydraulic properties (Figure 3b) calculated from soil texture and soil organic matter (model runs done with water content at field capacity of -0.01 MPa and wilting point of -6 MPa),
- soil dry out below wilting point at a rate driven by average statewide aridity,
- a switch allowing for the incorporation of urban impermeable surfaces, and
- internally calculated gaining and losing streams.
The model has been run at a monthly time scale to calculate the unimpaired water balance for every 18 acre (270-m) grid cell for all of California including all basins draining into the state (Figure 4) for 1981-2016. Average annual recharge for 1981-2010 is shown in Figure 5.
Rigorous calibrations have been performed statewide to improve the accuracy of all components of the water balance (Figure 4). Precipitation, snow processes, and the energy balance are developed and calibrated statewide. Calibrations are done to constrain the other variables, AET as a function of available soil water and vegetation type, recharge versus runoff as a function of soil storage and bedrock (Figure 2c) permeability. Calibration exercises have been done using a series of approaches to develop confidence in the regional estimates. Regional calibration means that errors are minimized statewide, and because they rely on bedrock types and vegetation types that may span across very large areas, errors may be positive or negative in different watersheds. Baseflow separation analyses at 160 streamgages, 20 basins for which recharge is estimated for groundwater flow modeling, gridded actual evapotranspiration estimates for 2000-2013 for 65 vegetation types, estimates of full natural flows from DWR (CDEC) for basins draining into the Central Valley, and 65 small basins with relatively unimpaired streamflow gages. Because of the regional calibration and associated errors, additional local calibration may be necessary to get the highest accuracy estimates for calculating the water budget in a given watershed. Model results are “unimpaired”, meaning they represent natural hydrologic conditions where water is not extracted from or delivered to a basin. Locations with mapped irrigated agriculture assume no irrigation and are treated as annual grasslands, and mapped urban footprints (from 2014 vegetation map) assume impermeable surfaces are represented by a bedrock permeability similar to granite for the whole footprint in the vegetation map, which increases runoff and decreases recharge in comparison to permeable surfaces.
Maps of BCMv8 results indicate where recharge and runoff are generated in a particular watershed. Recharge may not be generated directly over a groundwater basin footprint, but contribute as mountain front recharge from surrounding landscapes within a watershed or mountain block recharge directly into unsaturated bedrock. Recharge to a groundwater basin may also originate from adjacent surface water basins if the underlying geology is very permeable. Runoff may contribute to recharge in locations with losing streams and unsaturated zones. Values of recharge and runoff for all grid cells in a watershed can be accumulated to provide a first approximation of available water in a basin, some of which may leave via streamflows. The unimpaired "water supply" of a basin therefore can be approximated by recharge plus runoff. Local calibration to measured data can improve estimates.
Detailed documentation, methods, and all calibration results will be complete in 2018 to accompany this provisional dataset.
Provisional Dataset
Refined version of the California Basin Characterization Model (BCMv8) has been developed to improve quantitative estimates of the components of the water balance, include vegetation types, and increase ability to evaluate disturbance and management actions. These provisional results include estimates of natural recharge and runoff as a 30-year mean (1981-2010) plus water years 2011-2016.
Metadata
| Dataset | File Size | Last Modified |
|---|---|---|
| FGDC Metadata | 2017-07-24 | |
| FGDC Metadata (XML) | 14 KB | 2017-07-24 |
Basin Characterization Model v8 Datasets
| Dataset | File Size | Last Modified |
|---|---|---|
| rch1981_2010_ave.asc | 182.9 MB | 2017-06-27 |
| run1981_2010_ave.asc | 182.9 MB | 2017-06-27 |
Prepared in Cooperation with


Citation
Flint, L.E. and Flint, A.L., 2014, California Basin Characterization Model: A Dataset of Historical and Future Hydrologic Response to Climate Change, (ver. 1.1, May 2017): U.S. Geological Survey Data Release, https://doi.org/10.5066/F76T0JPB.