Mojave Groundwater Resources
2004 - 2009 Mojave Region Land-Subsidence Study
Introduction
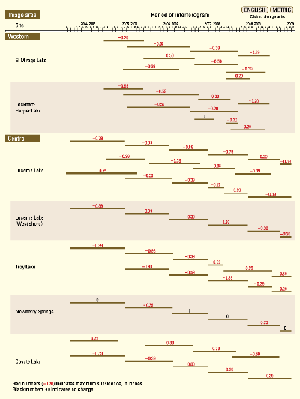
Figure 1. Magnitude of subsidence and temporal range for individual interferograms for the period of 2004-09 for each area of subsidence. (Available in English or Metric.)
Subsidence, in the vicinity of dry lakebeds, within the Mojave River and Morongo groundwater basins of the southwest Mojave Desert has been measured by Interferometric Synthetic Aperture Radar (InSAR). The investigation has focused on determining the location, extent, and magnitude of changes in land-surface elevation. In addition, the relation of changes in land-surface elevation to changes in groundwater levels and lithology was explored. This report is the third in a series of reports investigating land-surface elevation changes in the Mojave and Morongo Groundwater Basins, California. The first report, U.S. Geological Survey (USGS) Water-Resources Investigations Report 03-4015 by Sneed and others (2003), describes historical subsidence and groundwater-level changes in the southwest Mojave Desert from 1969 to 1999. The second report, U.S. Geological Survey Water-Resources Investigations Report 07-5097, an online interactive report and map, by Sneed and Brandt (2007), describes subsidence and groundwater-level changes in the southwest Mojave Desert from 1999 to 2004. The purpose of this report is to document an updated assessment of subsidence in these lakebeds and selected neighboring areas from 2004 to 2009 as measured by InSAR methods. In addition, continuous Global Positioning System (GPS)(2005-10), groundwater level (1951-2010), and lithologic data, if available, were used to characterize compaction mechanisms in these areas. The USGS California Water Science Center's interactive website for the Mojave River and Morongo groundwater basins was created to centralize information pertaining to land subsidence and water levels and to allow readers to access available data and related reports online. An interactive map of land subsidence and water levels in the Mojave River and Morongo groundwater basins displays InSAR interferograms, subsidence areas, subsidence contours, hydrographs, well information, and water-level contours. Background information, including a basic description of the mechanics of land subsidence and InSAR, as well as a description of the study area, is presented within the Mojave Water Resources Interactive Map and report.
Approach
Synthetic aperture radar (SAR) data from the European Space Agency's (ESA) ENVIronmental SATellite (ENVISAT) satellite were used to map and measure land subsidence in and near lakebeds in the Mojave River and Morongo groundwater basins. An overview of the mechanics of land subsidence and the InSAR technique for remotely sensing land subsidence is provided in the land subsidence section of the Mojave Water Resources website. ENVISAT orbits the Earth at an altitude of approximately 500 miles (mi), is side-looking, and has a 35-day repeat cycle. Eighty-three SAR scenes were used to produce 235 interferograms, which record change during the period between scenes; 32 of these were of sufficient quality for analysis and spanned periods ranging from 105 days to 22 months during 2004-09 (fig. 1). The InSAR interpretations, reported to a vertical precision of ±5 mm (0.19 in) in figure 1, represent the maximum subsidence within each subsidence area. Locations of maximum subsidence vary through time and could not be displayed as a continuous time series. Therefore, contour maps interpreted from selected interferograms display subsidence for specific interferogram periods. The areas of subsidence discussed in this report have been identified from the analysis and interpretation of several interferograms as areas exhibiting consistent deformation. Apparent patterns outside the identified subsidence areas result from degraded signal quality and should be ignored.
Nineteen interferograms were used to generate the subsidence time-series (figures 2-6) and the contour maps for each subsidence area. Stacked interferograms also are presented because the amounts of deformation calculated from individual interferograms were fairly small, sometimes making deformation difficult to discern in individual interferograms. The stacked interferograms were produced by summing subsets of the 19 individual interferograms. Additional post-processing techniques needed to generate the stacked interferograms improved the visualization of deformation areas, but degraded the deformation measurements. Consequently, the following discussion of subsidence magnitudes and rates is based on the individual interferograms, not the stacked interferograms. The stacked interferograms are discussed in the context of identifying spatial patterns of deformation.
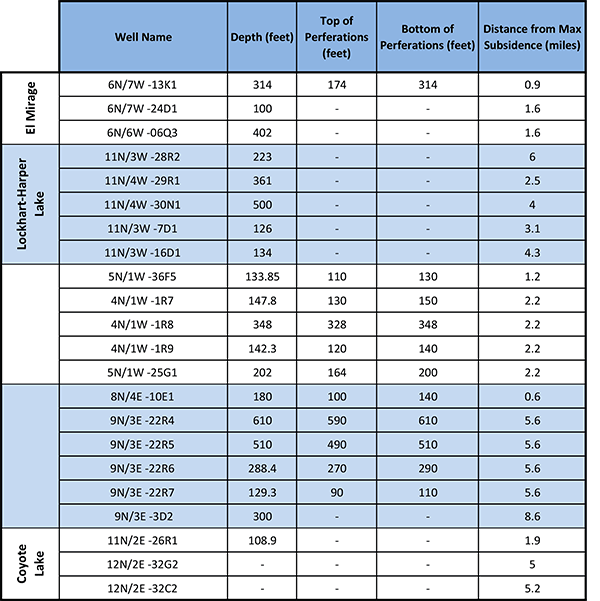
Table 1: Well depth, perforation depth, and distance from maximum subsidence area.
Continuous GPS data, where available, were plotted and compared to the InSAR measurements and cumulative deformation calculations. A 30-day running average of continuous GPS data at each site was calculated to accentuate long-term and seasonal trends while reducing signal error. Measurements of groundwater levels near subsiding areas were analyzed to identify possible connections between groundwater decline, subsidence, and subsidence rates. A description of wells and locations can be found in table 1. Well-driller's reports were examined to determine the presence and thickness of clay materials within the aquifer system in subsiding areas to help characterize the possible compaction mechanisms causing subsidence.
InSAR Results (2004-09)
Interferograms for the Mojave Water Management area were processed to assess vertical ground-surface deformation from 2004 through 2009 and are presented in the Mojave Water Resources Interactive Map. These interferograms revealed deformation in the same areas as reported by Sneed and others (2003) and Stamos and others, (2007) including El Mirage Lake area, located approximately 17 mi, or 28 kilometers (km), northwest of Victorville (Western Stack A, May 14, 2005, to May 23, 2009); Harper Lake area, located approximately 16 mi (25 km) northwest of Barstow (Western Stack B, November 5, 2005, to June 7, 2008); and Lucerne Lake area, located approximately 2 mi (4 km) north of Lucerne Valley (Central Stack A, July 19, 2004, to November 30, 2009). Subsidence continued near the town of Newberry Springs, but the maximum deformation (Central Stack B, July 19, 2004 to November 30, 2009) was located at Troy Lake, located approximately 7 mi (11 km) east of the previously documented deformation. The Coyote Lake area, located approximately 9 mi (15 km) northeast of Yermo, revealed ground-surface deformation from 2004 to 2009 (Central Stack C, July 19, 2004, to November 30, 2009) that had not been present in the previous time periods of analyzed InSAR data. These measurements of vertical land-surface deformation from consecutive periods for each area were summed to calculate deformation rates.
El Mirage Lake
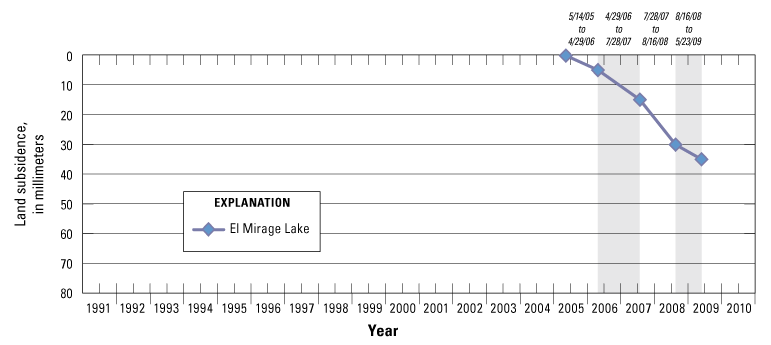
Land surface subsided a total of about 35 millimeters (mm), or 1.38 inches (in.), from May 2005 to May 2009 near the southeastern tip of El Mirage Lake (dry) at a fairly steady rate of about 9 millimeters per year (mm/yr), or 0.35 inches per year (in./yr), (fig. 2A).
 Figure
2A: Time-series graph showing subsidence observed by analysis of InSAR data for areas south of El Mirage Lake (dry) in the Mojave River and Morongo groundwater basins, Mojave Desert, California, from May 2005 to May 2009. Shaded areas of
the graph indicate alternating interferogram periods.
Figure
2A: Time-series graph showing subsidence observed by analysis of InSAR data for areas south of El Mirage Lake (dry) in the Mojave River and Morongo groundwater basins, Mojave Desert, California, from May 2005 to May 2009. Shaded areas of
the graph indicate alternating interferogram periods.
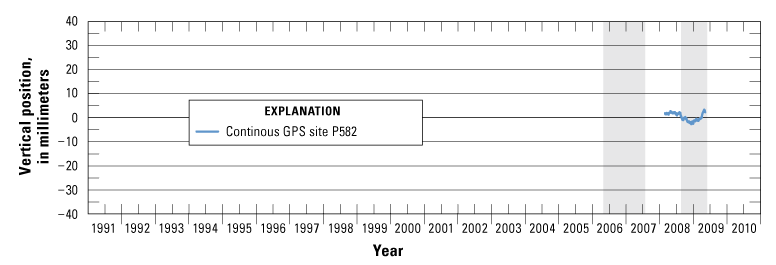
A plot of 30-day running average of unfiltered data from continuous GPS station P582, about 1.6 mi north of the maximum subsidence area near El Mirage Lake, showed nearly 3 mm/yr (0.12 in./yr) of land subsidence from April 2008 to May 2009. In addition, this station showed a rise during the spring of 2009 of a similar magnitude, which could result from small elastic seasonal fluctuations (fig. 2B). The small amounts of deformation at P582 were not discernible in the interferograms.
 Figure
2B: Vertical changes in land surface of continuous GPS site P582, near El Mirage Lake, from 2008 to 2009.
Figure
2B: Vertical changes in land surface of continuous GPS site P582, near El Mirage Lake, from 2008 to 2009.
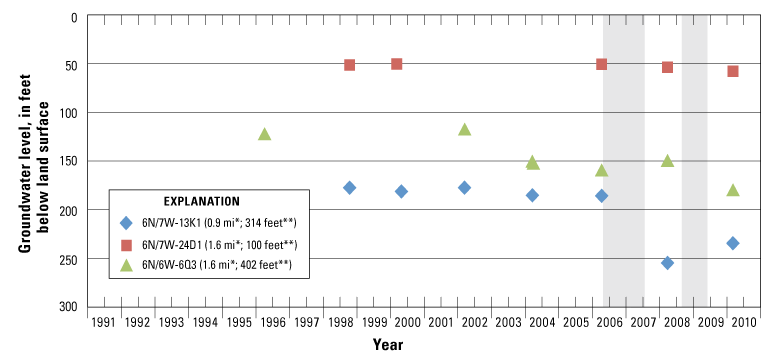
Groundwater levels measured in the spring months during 2006-10 indicated declines in shallow and deep wells near the area of maximum subsidence (fig. 2C); however, the infrequent (biennial) groundwater-level measurements prohibited determination of any seasonal fluctuations. Groundwater levels in the relatively shallow well (100 feet deep) 6N/7W-24D1 showed a decline of 7 feet (ft) from 2006 to 2010. Groundwater levels in the deeper well (314 ft deep) 6N/7W-13K1 showed a decline of nearly 50 ft from 2006 to 2010. Groundwater levels measured in another relatively deep well (400 ft deep) 6N/6W-6Q3 showed a decline of 20 ft from 2006 to 2010 (fig. 2C). Lithologic logs 6N/6W-18L2, 6N/6W-18P4, and 6N/6W-30M3 reported an appreciable amount of clay, with layers ranging from 5 to 295 ft in thickness, beneath the subsidence areas.
 . Figure
2C: Groundwater levels in wells near the El Mirage subsidence area, 1996�2010. (* indicates distance from maximum subsidence area, in miles; ** indicates well depth in feet below land surface)
. Figure
2C: Groundwater levels in wells near the El Mirage subsidence area, 1996�2010. (* indicates distance from maximum subsidence area, in miles; ** indicates well depth in feet below land surface)
The spatial and temporal coincidence of groundwater-level decline and subsidence measured by InSAR indicated these two processes are related. Although fairly thick and thin clay units were evident from lithologic data of previously mentioned wells, deductions about whether subsidence is inelastic, elastic, residual, or concomitant with groundwater-level decline, were not possible owing to the infrequent availability of recent and historical measurements of groundwater levels in the area of subsidence.
Harper Lake
Land surface subsided about 35 mm (1.38 in.) between November 2005 and May 2009 in the dry Harper Lake area, an average rate of about 9.9 mm/yr (0.39 in./yr) (fig. 3A).
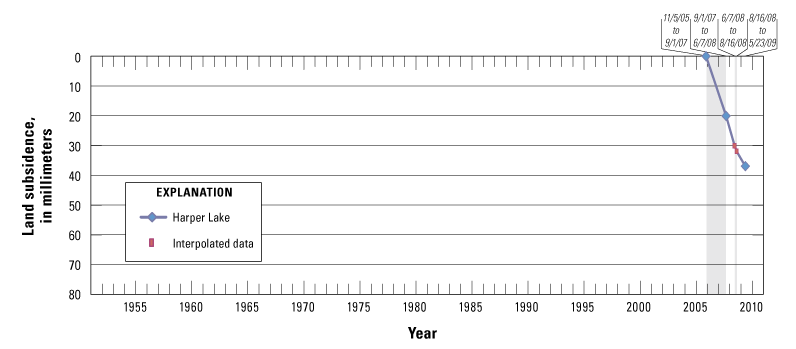
Figure 3A:Time-series graph showing subsidence observed by analysis of InSAR data for the dry Harper Lake subsidence area in the Mojave River and Morongo groundwater basins, Mojave Desert, California,
from November 2005 to May 2009. The dashed line represents interpolated subsidence based on rates calculated from measured data. Shaded areas of the graph indicate alternating interferogram periods.
InSAR data were unavailable for a two month period from June 2008 to August 2008. Therefore, the average rate of subsidence, at Harper Lake, was interpolated from interferograms generated before and after the missing data. InSAR interpretations on the western edge of the dynamic playa surface, about 4 mi west of the measured subsidence area at Harper Lake, were not possible because of decorrelation, depicted as randomized colors, in individual interferograms. A more detailed description of decorrelation can be found in Mojave land-subsidence studies section of Sneed and Brandt (2007)
Groundwater levels measured from several wells near the subsiding areas were examined to ascertain if a connection between groundwater-level change and land subsidence was evident. Groundwater levels in shallow and deep wells show varied water-level changes from 2004 to 2010 (fig. 3B).
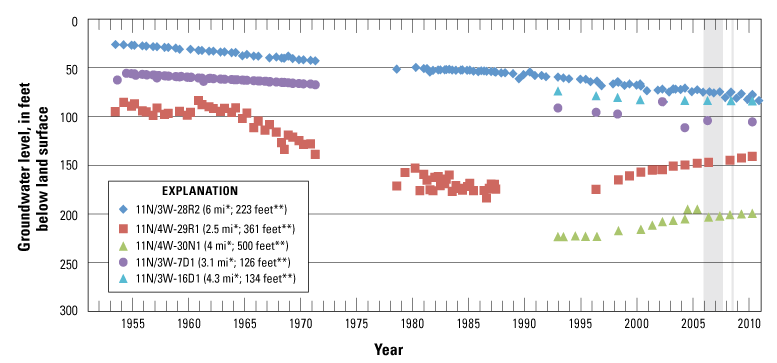
Figure 3B:Groundwater levels in wells near the Lockhart-Harper
Lake subsidence area, 1953-2009. (* indicates distance from maximum subsidence area, in miles; ** indicates well depth, in feet below land surface)
Shallow wells (11N/3W-7D1 and 11N/3W-16D1) showed gradually declining and stable water levels; the intermediate-depth well (11N/3W-28R2) showed water-level decline; and deep wells (11N/4W-29R1 and 11N/4W-30N1) showed water-level recovery. Groundwater levels in well 11N/3W-16D1 were stable from March 2004 to March 2010. Groundwater levels measured in well 11N/3W-28R2 showed seasonal (where groundwater levels in the spring were generally higher than groundwater levels in the fall) water-level fluctuations, superimposed on annual declines that resulted in a net decline of about 8 ft from 2005 to 2009. Groundwater levels in well 11N/4W-29R1 showed 9 ft of recovery from April 2005 to March 2010. Groundwater levels in well 11N/4W-30N1 indicated 5 ft of recovery from March 2004 to March 2010.
The spatial extent of subsidence at Harper Lake measured by InSAR from November 2005 to May 2009 coincided with the geographic extent of the dry lakebed of eastern Harper Lake. It is possible that a relationship exists between subsidence and paleo-lakebed deposits. Lithologic logs near the Harper Lake area were examined. Six clay layers ranging from 8 to 89 ft thick and totaling 232 ft identified in well 11N/3W-8N1 (1,117-ft depth), located about 2 mi from the maximum subsidence area, indicated thick aquitards at shallow (35 to 125 ft below land surface) and deep (860 to 1,117 ft below land surface) depths. However, the lack of more detailed lithologic information and groundwater-level measurements within the subsidence area prohibited the interpretation of subsidence mechanisms.
Lucerne Lake
Land surface subsided a maximum of nearly 70 mm (2.76 in.) from July 2004 to November 2009 south of Lucerne Lake at a fairly steady rate of about 13 mm/yr (0.51 in./yr) . A secondary subsidence feature of 40 mm (1.75 in.), subsided at a fairly steady rate of about 7 mm/yr (0.28 in./yr) on the western shore of Lucerne Lake during this same period (fig. 4A).
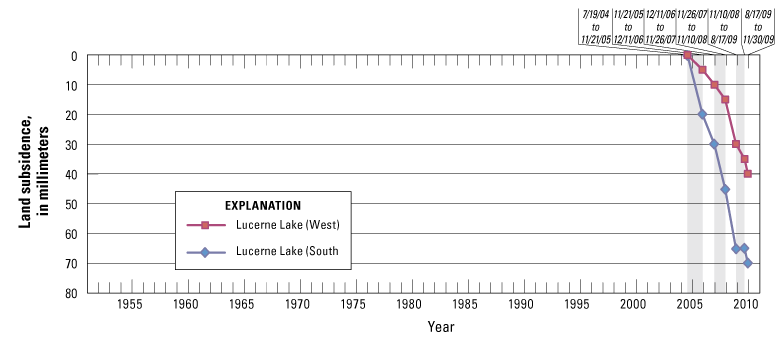
Figure 4A: Time-series graph showing subsidence observed by analysis of InSAR data for two areas south and west of Lucerne Lake in the Mojave River and Morongo groundwater basins, Mojave Desert,
California, from July 2004 to November 2009. Shaded areas of the graph indicate alternating interferogram periods.
The two subsidence areas appeared to be parts of one larger area containing the dry lakebed of Lucerne Lake. InSAR interpretations within the dynamic playa surface were not possible because interferograms displayed a decorrelated signal shown as randomized colors. Subsidence features located on the fringes of the dry lakebed, however, were sufficient to delineate the areal extent of subsidence. Seasonal or other temporal variations in subsidence rates were not evident in the interferograms. In addition, a 30-day running average of unfiltered data from the continuous GPS site P606, located 3.6 mi outside of the Lucerne Lake subsidence area, showed about 10 mm (0.39 in.) of seasonal fluctuation of land-surface elevation; however, there was nearly no change from 2005 to 2009, indicating that most of the deformation was elastic (fig. 4B).
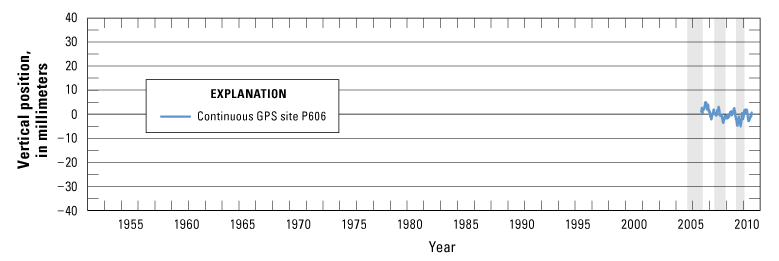
Figure 4B: Vertical change in land surface at continuous GPS site P606, near Lucerne Lake, from 2005 to 2010.
Groundwater levels in wells 5N/1W-25G1, 5N/1W-36F5, and nested piezometers 4N/1W-1R7 and -1R8 near the maximum subsidence area, showed varied trends at different depths. Groundwater levels in piezometer 4N/1W-1R7 and well 5N/1W-36F5, with screened intervals within 150 ft of land surface, exhibited declines of less than 5 ft from 2005 to 2009 (fig. 4C).
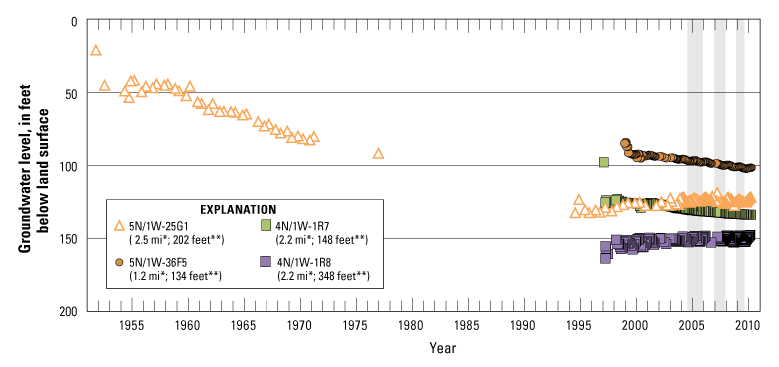
Figure 4C: Groundwater levels in wells near the Lucerne Valley subsidence area, 1951-2009. (* indicates distance from maximum subsidence area, in miles; ** indicates well depth in feet below land surface)
Groundwater levels in piezometers 4N/1W-1R8 and 5N/1W-25G1, with screened intervals below 150 ft, exhibited seasonal groundwater-level fluctuations superimposed on a recovery trend from 2005 to 2009 (fig. 4C). Historical groundwater-level measurements from well 5N/1W-25G1 showed a decline of about 100 ft from the early 1950s to the early 1990s (fig. 4C), then recovered slightly through the late 2000s. Lithologic logs were examined to determine if fine-grained material was present in this area. A generalized lithology compiled by Huff and others (2002) reports the presence of two clay layers totaling 60 ft in thickness within the upper 180 ft, and no clay in the remaining 620 ft of the depth of the nested wells 4N/1W-1R4-9.
The subsidence at Lucerne Lake measured by InSAR from July 2004 to November 2009, groundwater-level data, and lithologic information indicated that the subsidence could be caused by declining groundwater levels in the upper portions of the aquifer. The small water-level declines in the aquifer, measured from shallow wells 5N/1W-36F5 and 4N/1W-1R7, could have resulted in a small amount of concomitant compaction. In addition, the presence of fairly thick clay layers indicated that a component of residual compaction also was possible because of the time lag associated with the equilibration of pressure heads between the confining layer and adjacent aquifers. Residual compaction takes place in confining layers when their hydraulic heads equilibrate with those in adjacent aquifers. The time lag between the declining hydraulic head and compaction is dependent upon the thickness and vertical hydraulic diffusivity of the confining layer (Stamos and others, 2007). Neither concomitant nor residual compaction in deeper portions of the aquifer system were likely because water levels were recovering from historic lows, and thick clay layers were absent in the deeper aquifer in the vicinity of nested wells 4N/1W-1R4-9 (Huff and others, 2002). The residual or concomitant compaction of thick clay layers, possibly caused by groundwater levels when at their historical lows in shallow portions of the aquifer, could be permanent if preconsolidation stress levels were surpassed. The spatial extent of the subsidence feature at Lucerne Lake coincided with the geographic extent of the Lucerne Lake dry lakebed, indicating that paleo-lakebed sediments could be compacting and causing the land subsidence.
Troy Lake/Newberry Springs
Land surface subsided a maximum of about 50 mm (1.96 in.) at an average rate of about 9 mm/yr (0.35 in./yr) on and adjacent to the western and southern shores of Troy Lake near Newberry Springs from July 2004 to November 2009 (fig. 5A). Subsidence here represents a local maximum of a larger area, with smaller magnitude deformation extending north to the Mojave River and as far west as the Barstow Daggett County Airport. The larger-area subsidence was negligible in individual interferograms; however, stacked interferograms exhibiting the cumulative change showed as much as 10 mm (0.39 in.) of localized subsidence from July 2004 to November 2009 (Central Stack B, July 19, 2004, to November 30, 2009). In addition to the maximum subsidence at Troy Lake, land surface subsided about 25 mm (0.98 in.), at an average rate of nearly 5 mm/yr (0.20 in./yr), from July 2004 to November 2009 at Newberry Springs; subsidence at this location was reported previously (Sneed and others, 2003; Stamos and others, 2007).
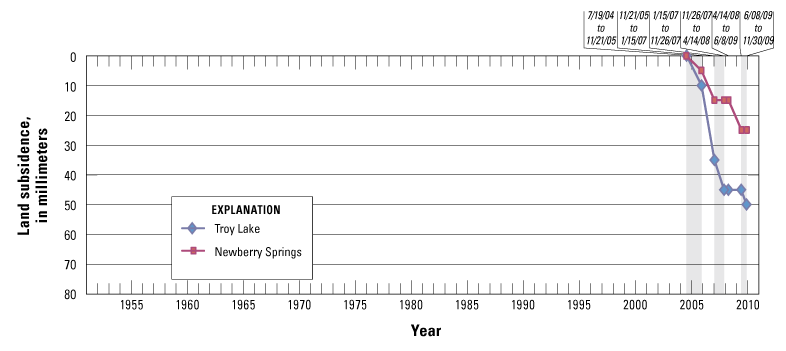
Figure 5A: Time-series graph showing subsidence observed by analysis of InSAR data for the southwestern shores of Troy Lake and in Newberry Springs in the Mojave River and Morongo Groundwater Basins, Mojave Desert, California, from July 2004 to November 2009. Shaded areas of the graph indicate alternating interferogram periods.
Groundwater levels measured in well 8N/4E-10E1 showed a decline of about 2.5 ft between March 2004 and March 2008, punctuated by a sharp decline of 11 ft in April 2008; there were no subsequent measurements. Wells 9N/3E-22R6 and -22R7 showed seasonal water-level fluctuations superimposed on less than 2 ft of annual declines from December 2004 to December 2006. Seasonal fluctuations in well 9N/3E-22R6 continued as the average water level stabilized annually from February 2007 to March 2010. Water-level measurements in well 9N/3E-22R7 from February 2007 to March 2010 also stabilized; however, water-level measurements were too infrequent to determine any seasonal fluctuations from 2007 to 2010. Previous groundwater-level measurements in this cluster showed a decline of 20 ft from 1993 to 2006. Historical groundwater levels from well 9N/3E-3D2 showed a decline of 54 ft from 1956 to 1992 (fig. 5B). Combining the records from 9N/3E-3D2 and 9N/3E-22R6, which are screened about 300 ft below land surface, indicated about 80 ft of water-level decline from 1956 to 2010. Lithologic logs were examined to help in the interpretation of subsidence mechanisms. A generalized lithology constructed from borehole and geophysical data obtained from wells 9N/3E-22R4-7 shows six layers of fine-grained sediments ranging from 3 to 100 ft thick and totaling 138 ft in thickness from 60 to 470 ft below land surface (Huff and others, 2002).
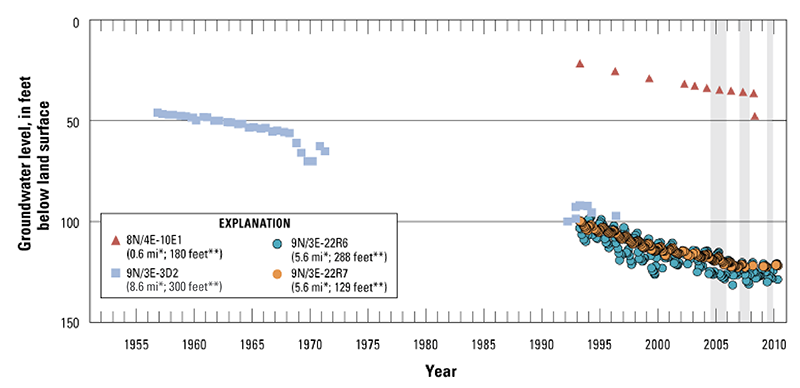
Figure 5B: Groundwater levels in wells near the Troy Lake subsidence area, 1957-2009. (* indicates distance from maximum subsidence area, in miles; ** indicates well depth in feet below land surface)
The spatial extent of the maximum subsidence area coincided with the geographic location of Troy Lake, indicating that paleo-lakebed sediments could be compacting and causing land subsidence. The subsidence at Troy Lake measured by InSAR from July 2004 to November 2009, groundwater-level measurements, and lithologic information indicated subsidence could be caused by groundwater-level changes. The small water-level declines in shallow wells between 2004 and 2010 could have resulted in small amounts of concomitant compaction. However, the presence of thick clay layers, large historical groundwater-level declines, recent subsidence, and recent water-level stabilization (on an annual basis) indicated there could also be residual compaction. The continuous decline of groundwater levels that reached historical lows in 2006 indicated that the preconsolidation stress could have been surpassed in some parts of the aquifer-system, which results in inelastic (permanent) compaction.
Coyote Lake
Land surface subsided about 45 mm (1.77 in.) from July 2004 to November 2009 at a fairly steady rate of about 8 mm/yr (0.31 in./yr) at the southern tip of Coyote Lake (fig. 6A); seasonal or other temporal variability of subsidence rates was not evident in the interferograms.
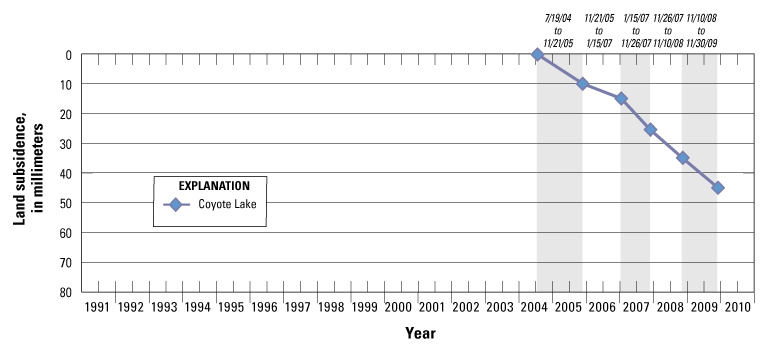
Figure 6A: Time-series graph showing subsidence observed by analysis of InSAR data for the southern tip of Coyote Lake in the Mojave River and Morongo groundwater basins, Mojave Desert, California, from July 2004 to November 2009. Shaded areas of the graph indicate alternating interferogram periods.
Groundwater-level data near this area were spatially and temporally sparse. The few water-level measurements from wells 12N/2E-32G2 and 12N/2E-32C2 generally showed stable readings with no discernible decline or recovery trends from 2004 to 2010 (fig. 6B). Groundwater levels measured in well 11N/2E-26R1 indicated stability between 1991 and 2009, but declined nearly 35 ft from March 2009 to March 2010. A subsequent groundwater-level measurement in October 2010 indicated that the water level remained low (fig. 6B).
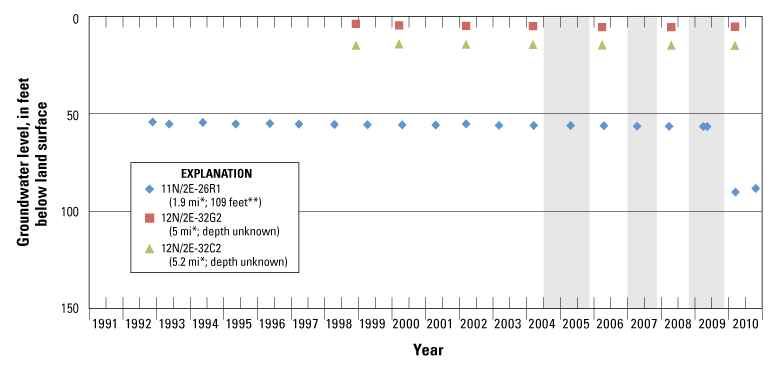
Figure 6B: Groundwater levels in wells near the Coyote Lake subsidence area,1993-2009. (* indicates distance from maximum subsidence area, in miles; ** indicates well depth in feet below land surface)
A discussion of possible mechanisms responsible for subsidence occurring near Coyote Lake is hindered by the lack of groundwater-level measurements and knowledge of the lithology within the subsidence area. It is unclear if subsidence detected between 2004 and 2009 by InSAR analysis was driven by recent or historical water-level declines, by a surficial process, or by some other mechanism.
Summary
Subsidence within the Mojave Water Management area typically is found in the vicinity of dry lakebeds. Either the entire dry lakebed subsides, as in the cases of Harper Lake, Lucerne Lake, and Troy Lake, or subsidence is manifested near the edges, as in the cases of El Mirage and Coyote Lake. In either case, the subsidence is likely a result of compaction of the fine-grained sediments of paleo-lakebed deposits. Subsidence data coupled with groundwater-level measurements and lithologic information aided in interpretations of subsidence mechanisms for the Lucerne Lake and Troy Lake subsidence areas. Declining groundwater levels and the presence of fairly thick clay layers in the shallow portion of the aquifer below the Lucerne Lake subsidence area indicated concomitant and residual compaction was possible and could be occurring in the shallow portions of the aquifer; whereas slightly recovering groundwater levels and the absence of thick clays in the deeper aquifer indicated neither concomitant nor residual compaction at depth. The subsidence at Troy Lake likely resulted from a combination of concomitant and residual compaction. This was evidenced by shallow groundwater-level decline, recent stabilization of groundwater levels at depth, and extensive clay deposits. Groundwater levels and lithologic information were assessed at El Mirage Lake, Lockhart-Harper Lake, and Coyote Lake; however, the lack of spatially or temporally extensive groundwater-level measurements and lithologic data prevented determination of subsidence mechanisms.
Mojave Region Maps
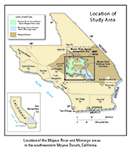
General Location
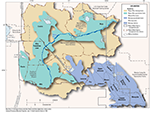
Detailed Location Map
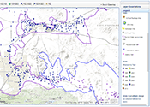
Interactive Data Map
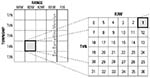
Well-Numbering System

To view PDF documents, you must have Adobe Reader installed on your computer.