Mojave Groundwater Resources
2000 Mojave Region Water-Level Study
Groundwater Levels
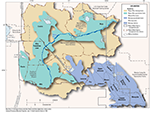
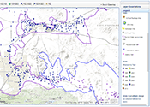
Static water-level measurements collected during the spring of 2000 by the U.S. Geological Survey (USGS), the Mojave Water Agency (MWA), and local water districts from about 680 wells were used to construct a regional water-table map, which shows the altitude of the water table and general direction of ground-water movement in the Mojave River and Morongo ground-water basins. Water-level contours from the 1998 water-level map (Smith and Pimentel, 2000) were used as a guide to interpret the 2000 water-level contours in areas where 2000 water-level data were not available. In addition to being available on the interactive map (2000 water-level contours on interactive map), the 2000 water-level data and contours are shown on a PDF formatted plate. Historical water-level data were used in conjunction with data collected from this study to construct 42 water-level hydrographs to show both long-term (as early as 1930) and short-term (beginning in 1990) water-level changes in the Mojave River and Morongo ground-water basins. Water-level changes between spring 1998 and spring 2000 (on interactive map) were determined by comparing water levels measured in the same well during both periods.
Water-Level Changes
In most areas of the Mojave River and Morongo ground-water basins, water levels remained relatively unchanged from 1998 to 2000 (water-level change on interactive map); however, there were some significant changes along the Mojave River in the Alto and Baja subareas and in the Centro subarea near Hodge and Lenwood. In the Morongo ground-water basin, water levels rose significantly in the Lucerne and Warren subbasin. To illustrate water-level changes for periods greater than 2 years, 42 hydrographs were created for the basins (PDF formatted plate, hydrographs).
Historical water-level data were used in conjunction with data collected during this study to determine both long-term (1930–2000) and short-term (1996–2000) water-level changes in the Mojave River and the Morongo ground-water basins. Long-term water-level changes are depicted by 29 water-level hydrographs (PDF formatted plate, hydrographs) that include data collected from the early 1930s. Some hydrographs combine data from more than one well in order to show water-level changes over a greater period in a given area. Thirteen short-term hydrographs were constructed from data collected between 1996 and 2000 along the Mojave River. These short-term hydrographs show the effects of seasonal recharge and discharge along the river. Recharge along the Mojave River is primarily from infiltration of stormflows, usually during January through March and artificially at the Rock Springs, Hodge, and Lenwood outlets.
In the Mojave River ground-water basin, a comparison of ground-water levels measured in the spring of 1998 and the spring of 2000 indicates that changes in the regional aquifer system generally were less than or equal to 5 ft. Water levels measured in wells along the Mojave River showed the greatest change. In the Alto subarea, water levels declined as much as 37 ft. Farther downstream in the eastern Centro and the Baja subareas, water levels declined as much as 35 ft. Water levels in the Alto Transition Zone showed little change. However, water levels in the Centro subarea rose as much as 22 ft near the artificial-recharge sites of the Hodge Outlet (near well 9N/3W-22J4) and the Lenwood Outlet (near well 9N/3W-1R7) (PDF formatted plate).
In the Morongo ground-water basin, a comparison of ground-water levels measured in the spring of 1998 and the spring of 2000 indicates that, in most wells, water levels changed 5 ft or less. However, wells in the Warren and Lucerne subbasins showed greater water-level changes. In the Warren subbasin, continuing artificial ground-water recharge has resulted in water-level rises as great as 49 ft (well 1N/5E-36M6); however, water levels in other parts of this subbasin declined as much as 69 ft (well 1N/5E-36L1) (Warren Subbasin map, hydrographs). In the Lucerne subbasin, water levels rose as much as 24 ft and declined as much as 7 ft.
Complete accessible text of report (6.9 MB PDF)
Plate 1 (2.2 MB)
Printable version of Plate 1 (2.9 MB)
Mojave Region Maps
General Location
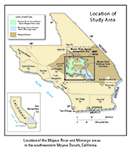
Detailed Location Map
Interactive Data Map
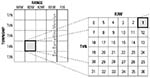
Well-Numbering System

To view PDF documents, you must have Adobe Reader installed on your computer.