Mojave Groundwater Resources
1996 Mojave Region Water-Level Study
Groundwater Levels
Static water-level measurements collected during January-September 1996 by the U.S. Geological Survey (USGS), the Mojave Water Agency (MWA), and local water districts from about 680 wells were used to construct a regional water-table map, which shows the altitude of the water table and general direction of groundwater movement in the Mojave River, Morongo, and Fort Irwin groundwater basins. Water-level contours from the 1992 and 1994 water-level maps (Stamos and Predmore, 1995; Trayler and Koczot, 1995) were used as a guide to interpret the 1996 water-level contours in areas where 1996 water-level data were not available. In addition to being available on the interactive map, the 1996 water-level data and contours are shown on a PDF formatted plate. Historical water-level data were used in conjunction with data collected from this study to construct 31 water-level hydrographs to show long-term (as early as 1930) water-level changes in the Mojave River, Morongo, and Fort Irwin groundwater basins. Water-level changes were determined by comparing water levels measured in 1996 with water levels reported by Stamos and Predmore (1995) for the Mojave River groundwater basin and by Trayler and Koczot (1995) for the Morongo groundwater basin. Twenty wells measured in 1994 in the Fort Irwin groundwater basins were compared with 1996 water-level data.
Water-Level Changes
Thirty-one hydrographs show (PDF formatted plate, hydrographs) long-term water-levels changes in the study area. Selected hydrographs include data from more than one well in order to show a longer period of record. The long-term hydrographs indicate a general decline in water levels in wells near areas of heavy groundwater withdrawal in the regional aquifer.
In the Alto subarea of the Mojave River groundwater basin, water levels have declined as much as 60 ft since the 1940’s (4N/3W-1M1 and 5N/5W-22E1, -22E2) (hydrographs). This decline is a reflection of groundwater withdrawal for the cities of Adelanto, Apple Valley, Hesperia, and Victorville. In the Centro subarea, water levels west of Harper Lake (11N/4W-29R1) have declined about 90 ft since 1954; water levels east of Harper Lake (combined hydrograph 11N/3W-28R1, -28R2) have declined about 30 ft since 1950, probably because of agricultural pumpage; and water levels east of Iron Mountain and south of the Mojave River (9N/2W-19B1 and 9N/3W-13R1) have declined about 30 ft since 1932. Water levels have remained relatively constant in the southeastern part of the subarea (9N/1W-27D1), where groundwater withdrawal from the regional aquifer is minimal. In the eastern part of the Baja subarea near Newberry Springs, the water table has declined as much as 75 ft since 1930 (9N/3E-34D1, -34N1); this decline also reflects the effects of groundwater withdrawal for agriculture.
The hydrographs of wells in the shallow alluvial aquifer in the Alto and the Centro subareas, and to a lesser degree in the Baja subarea, show alternating periods of declining and rising water levels (4N/4W-1D2; 5N/4W-11P1, -11P3; 8N/4W-12Q1; 8N/4W-31R1; 9N/3E-3D1, -3D2; 10N/2W-32B1, and -33R16). This cyclic pattern is related to the amount of flow in the Mojave River. During dry periods, when most of the Mojave River is dry and recharge from the river to the shallow alluvial aquifer is minimal, groundwater levels decline in response to natural discharge (evapotranspiration and groundwater underflow to other subbasins) and groundwater withdrawal. Ground-water levels rise during wet periods, when floodflows in the Mojave River recharge the shallow alluvial aquifer.
In the Alto and the Centro subarea of the Mojave River groundwater basin, long-term hydrographs indicate a general declining trend for wells in the shallow alluvial aquifer. The exception to this declining trend is shown by the hydrographs for wells (5N/4W-11P1, -11P3; 7N/4W-30C1), which have remained relatively constant. These wells are in the vicinity of the Narrows near Victorville where the Mojave River flows perennially. However, long-term hydrographs for wells in the Baja subarea indicate water-level declines of 50 ft or more (9N/1E-10L1; 9N3E-3D1, -3D2 and 9N/3E-34D1, -34N1). Lines (1996) estimated that the shallow alluvial aquifer in the Alto and the Centro subareas receives some recharge from the Mojave River each year, whereas the aquifer in the Baja subarea receives recharge only during periods of high flow. The water-level declines in the Baja subarea are the result of natural discharge and agricultural pumpage.
In the Morongo groundwater basin, hydrographs indicate that water levels have remained relatively constant in the Copper Mountain, the Deadman, the Johnson, and the Mesquite subbasins (1N/7E-23A1; 3N/7E-36G1; 3N/8E-29C1; 4N/3E-23G1; 1N/8E-12G1 and 1N/9E-33H2, respectively) where the population is small and the pumpage is minimal. Available data were insufficient to determine long-term water-table fluctuations in the Emerson, the Fry, the Pipes, or the Upper Johnson subbasins. Water tables have declined in the Lucerne, the Reche, the Surprise Spring, the Twentynine Palms, and the Warren subbasins. In the Lucerne subbasin, the water levels have declined about 100 ft in wells 5N/1W-25G1 and 5N/1E-17D1 since the early 1950's. In the Reche subbasin, the water level has declined 45 ft in well 2N/6E-18B1 since 1963. In the Twentynine Palms subbasin, the water level has declined 32 ft in well 1S/9E-3D1 since 1940. In the Surprise Spring subbasin, the water levels have remained relatively constant in well 3N/7E-31E1, but it has declined 115 ft in well 2N/7E-2C1 since 1952 as a result of groundwater withdrawal for the U.S. Marine Corps Air/Ground Combat Center (USMCAGCC). In the Warren subbasin near Yucca Valley, water levels have declined 309 ft in wells 1N/5E-36K1 and -36K2 (combined hydrograph, PDF formatted plate), since 1947. In the western part of the Warren subbasin, the water table has declined about 178 ft in well 11N/5E-34N1 since the late 1950's. These large declines probably are a result of pumpage for the Yucca Valley area.
In the Fort Irwin groundwater basins, data were available to construct long-term hydrographs for wells 14N/3E-14H1 and -32J1 in the Bicycle and the Irwin groundwater basins, respectively. These long-term hydrographs indicate that groundwater withdrawals to supply the National Training Center (NTC) have resulted in water-table declines of about 70 ft since the late 1960's in the northern part of the Bicycle groundwater basin and about 30 ft since 1943 in the central part of the Irwin groundwater basin.
In the Mojave River groundwater basin, the maximum water table rise was 52 ft and the maximum decline was 28 ft during the period 1992-96. The water level rose in at least one well during this period in all subareas. The most significant rises were in the Alto and the Centro subareas in the shallow alluvial aquifer, owing to groundwater recharge from floodflows in the Mojave River. Near the headwaters of the Mojave River in the Alto subarea, the water level rose about 22 ft in well 4N/3W-31L9. In the Transition area (within the Alto subarea), two wells had a rise in water level, the largest of which was about 30 ft in well 7N/4W-6N1. Where the Mojave River enters the Centro subarea, the water level rose about 13 ft in well 8N/4W-10Q1. Near Barstow, the water level rose about 45 ft in well 9N/3W-1R7 and 52 ft in well 9N/2W-1A2. East of Barstow, the water level rose about 28 ft in well 9N/1W-4J8. In the Baja subarea, west of the Camp Rock-Harper Lake Fault zone, formerly called the Waterman Fault, the water table indicated no significant change from previous measurements. In the Este subarea, the water level in well 4N/2W-12N2 rose about 12 ft. In the Oeste subarea, the water level in well 5N/7W-17D1 rose about 7 ft.
The water-table change interactive map also indicates the Mojave River groundwater basin had some areas where the water table has declined. In the Alto, the Centro, the Este, and the Oeste subareas, 11 wells indicated a decline in the water table. In the Baja subarea north of the Mojave River, 13 wells indicated a decline. The quantity and frequency of flow in the Mojave River declines rapidly when it reaches the Baja subarea (Lines, 1996); therefore, this subarea does not receive much groundwater recharge from stormflows.
In the Morongo groundwater basin, the maximum rise in the water table was 66 ft and the maximum decline was 57 ft. There was a rise in water levels in only 6 of the 17 groundwater subbasins. Of the wells measured in the Copper Mountain, the Deadman, the Pipes, and the Surprise Spring subbasins, only one well in each subbasin had a rise in water level. In the Lucerne, five wells had a rise in water levels with the largest rise of about 14 ft in well 5N/1W-36R1. The largest water-table rise and decline in the Morongo groundwater basin was in the Warren subbasin. The water-level rise of nearly 66 ft in well 1N/5E-326K3 probably resulted from a decrease in pumpage in the subbasin. The decline of nearly 57 ft in well 1N/6E-31C1 probably resulted from inadequate time for recovery from pumpage before the water-level measurement was made. The water-table change map also indicates that the water table declined by more than 5 ft in wells near the towns of Landers, Twentynine Palms, and Yucca Valley, which are supplied by municipal and domestic withdrawals of ground water. The water table in the Fort Irwin groundwater basins has remained relatively unchanged, with a maximum rise in the water table of 6 ft and the maximum decline 8 ft. Of the 11 wells measured in the Irwin groundwater basin, only well 14N/3E-32P6 indicated a significant rise in the water table (about 6 ft). In the Bicycle groundwater basin, well 14N/3E-24H1 had a decline in the water level of about 6 ft and well 14N/4E-18N2 had a decline of about 8 ft. In the Langford groundwater basin, none of the four wells measured had water-level fluctuations of more than 5 ft.
Mojave Region Maps
General Location
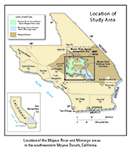
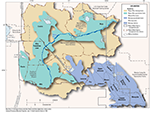
Detailed Location Map
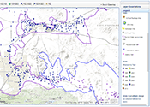
Interactive Data Map
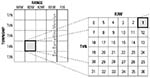
Well-Numbering System

To view PDF documents, you must have Adobe Reader installed on your computer.